
An In Depth Look at Ethereum's Rally
As Ethereum becomes the major focus of this market we are going to want to monitor its timing and cycle as close as we can.
There is no shortage of noise out there surrounding crazy price targets and predictions but we know the most important signal of all is time.
Today, I want to break down the ETH moves going all the way back to it’s inception so that we can get a better grasp on where this market is heading and in what time frame.
This will be a simple yet powerful and proven analysis of ETH time cycles and we will get a strong sense of dates to watch for the top or at least a top in this rally.
Length of Runs
As always the first thing we need to know about a trending market is what the average length of a run is.
Usually we look at the previous runs this cycle but below I want to show you all the major runs on ETH so you can get an idea of how important this concept is and how consistent its been.
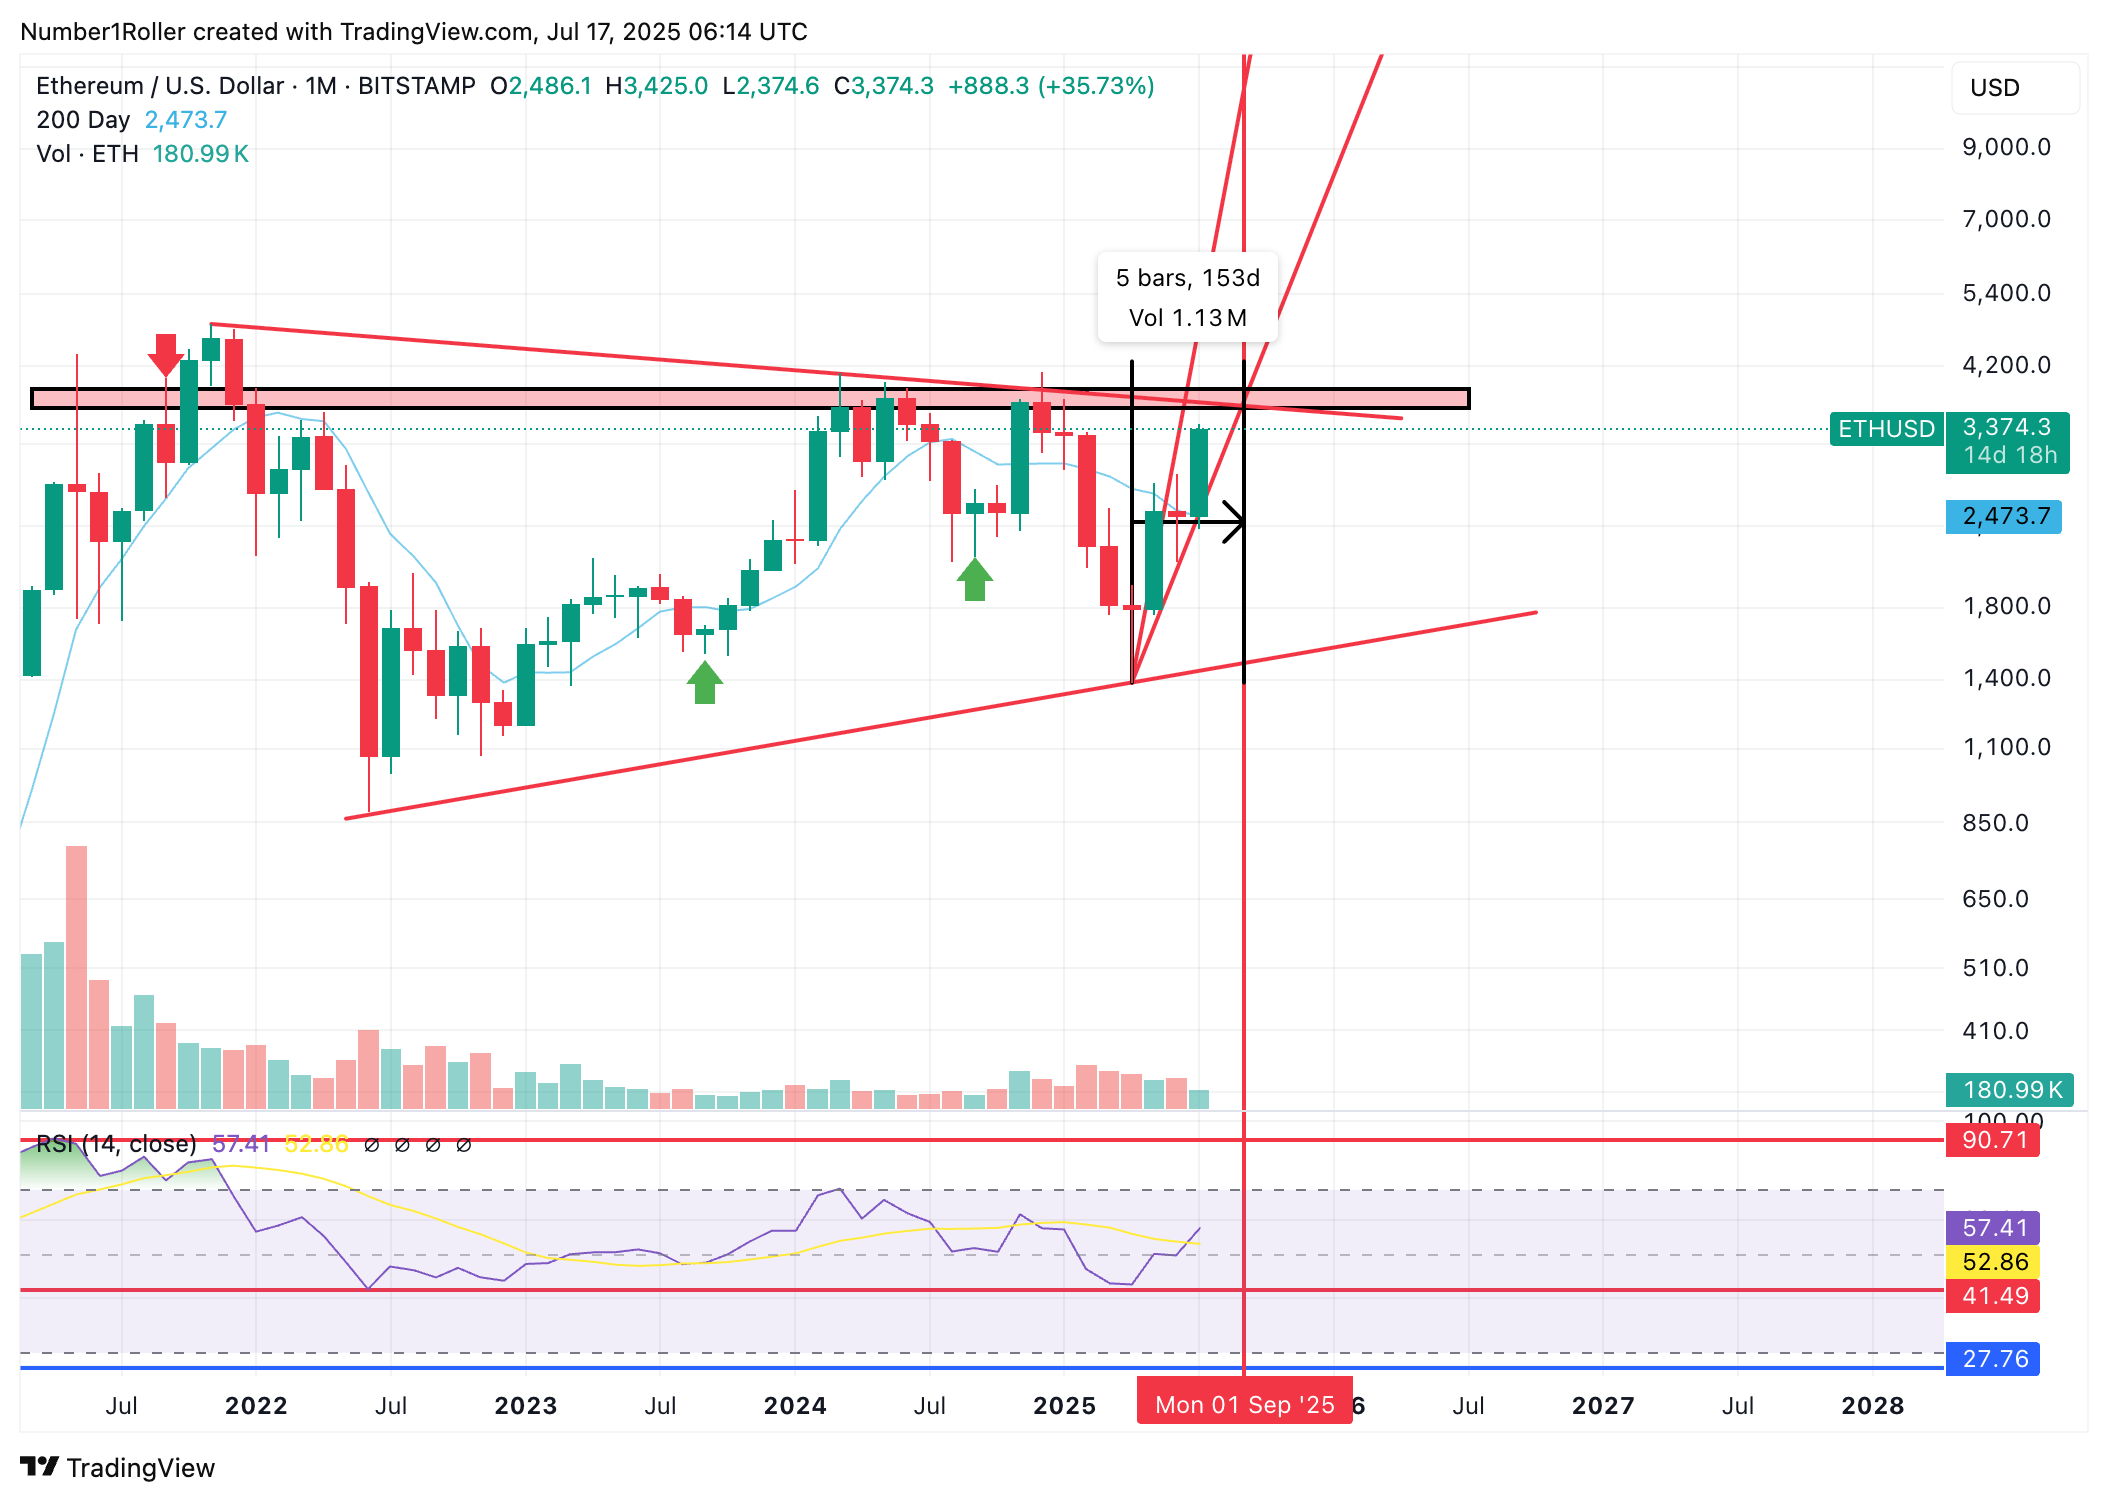
Below is the monthly chart of ETH.
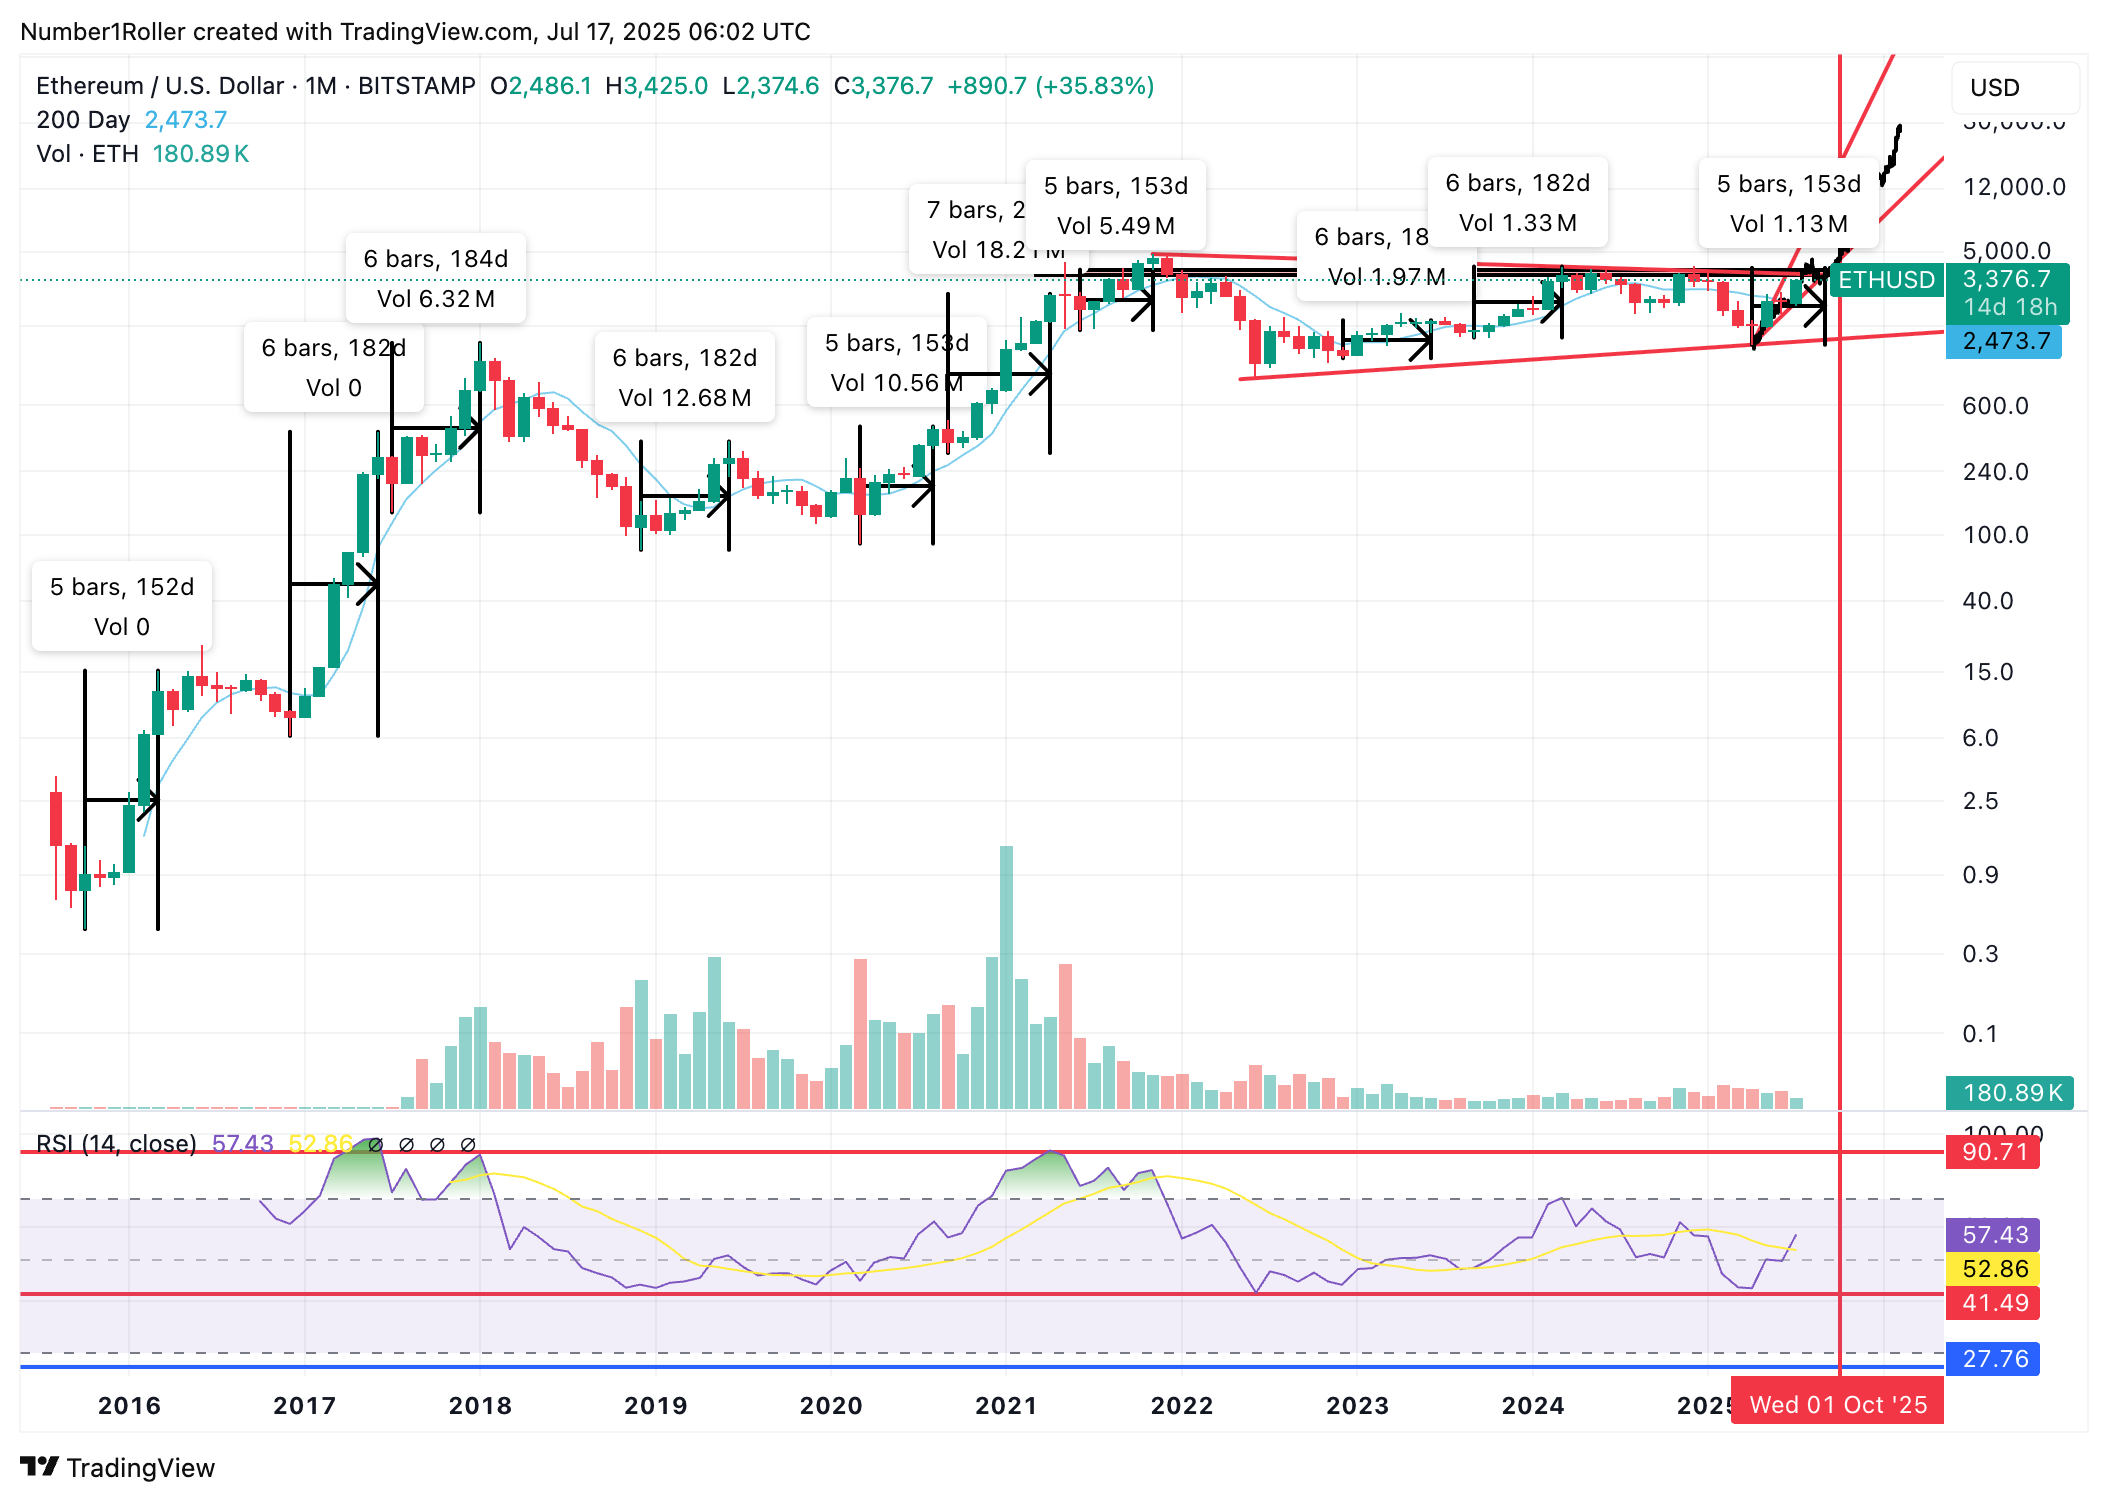
I have measured out nearly every major on ETH run from the start of the run to the first real monthly correction.
You can see with very strong consistency that runs typically last on average 5 to 6 months. That puts this run squarely in September at 5 months and October if we were to get a 6th month.
Of course there are a few exceptions to the data we always have to account for that but with the exception of one seven month move and a few shorter moves (pre covid crash was only 3 months, and last years August to November rally was only 4 months) the 5 to 6 month time window is very strong. And then the next month is usually a reversal month albeit not always a major reversal but a significant correction against the prevailing trend.
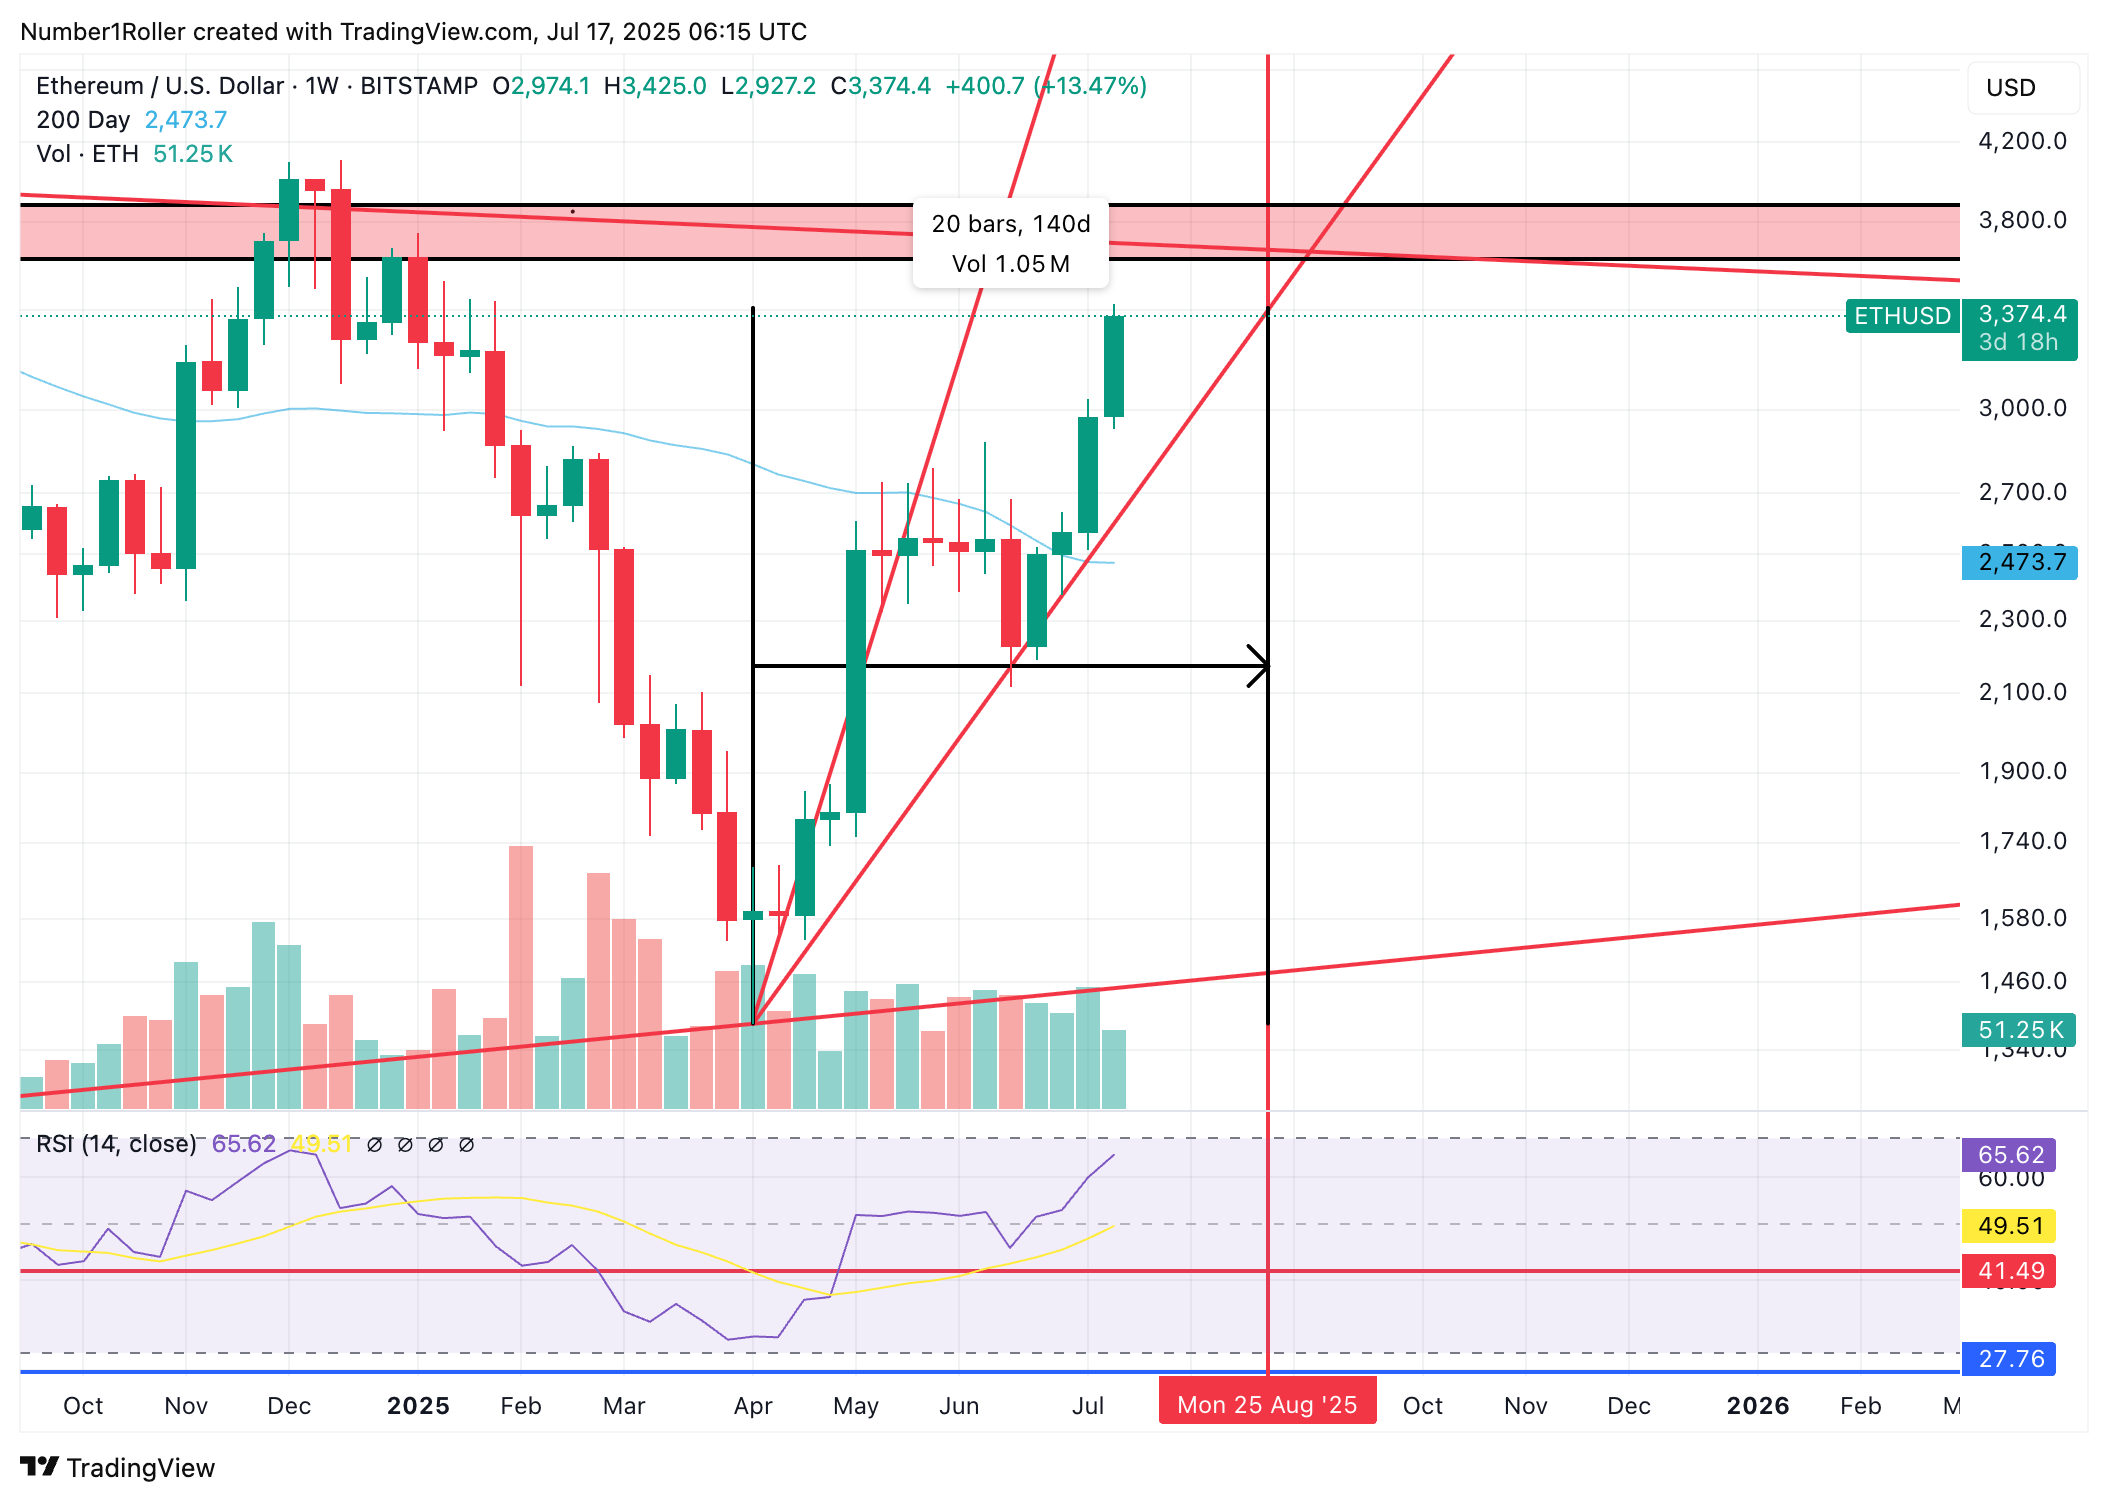
To get a closer look below I have done the weekly time counts.
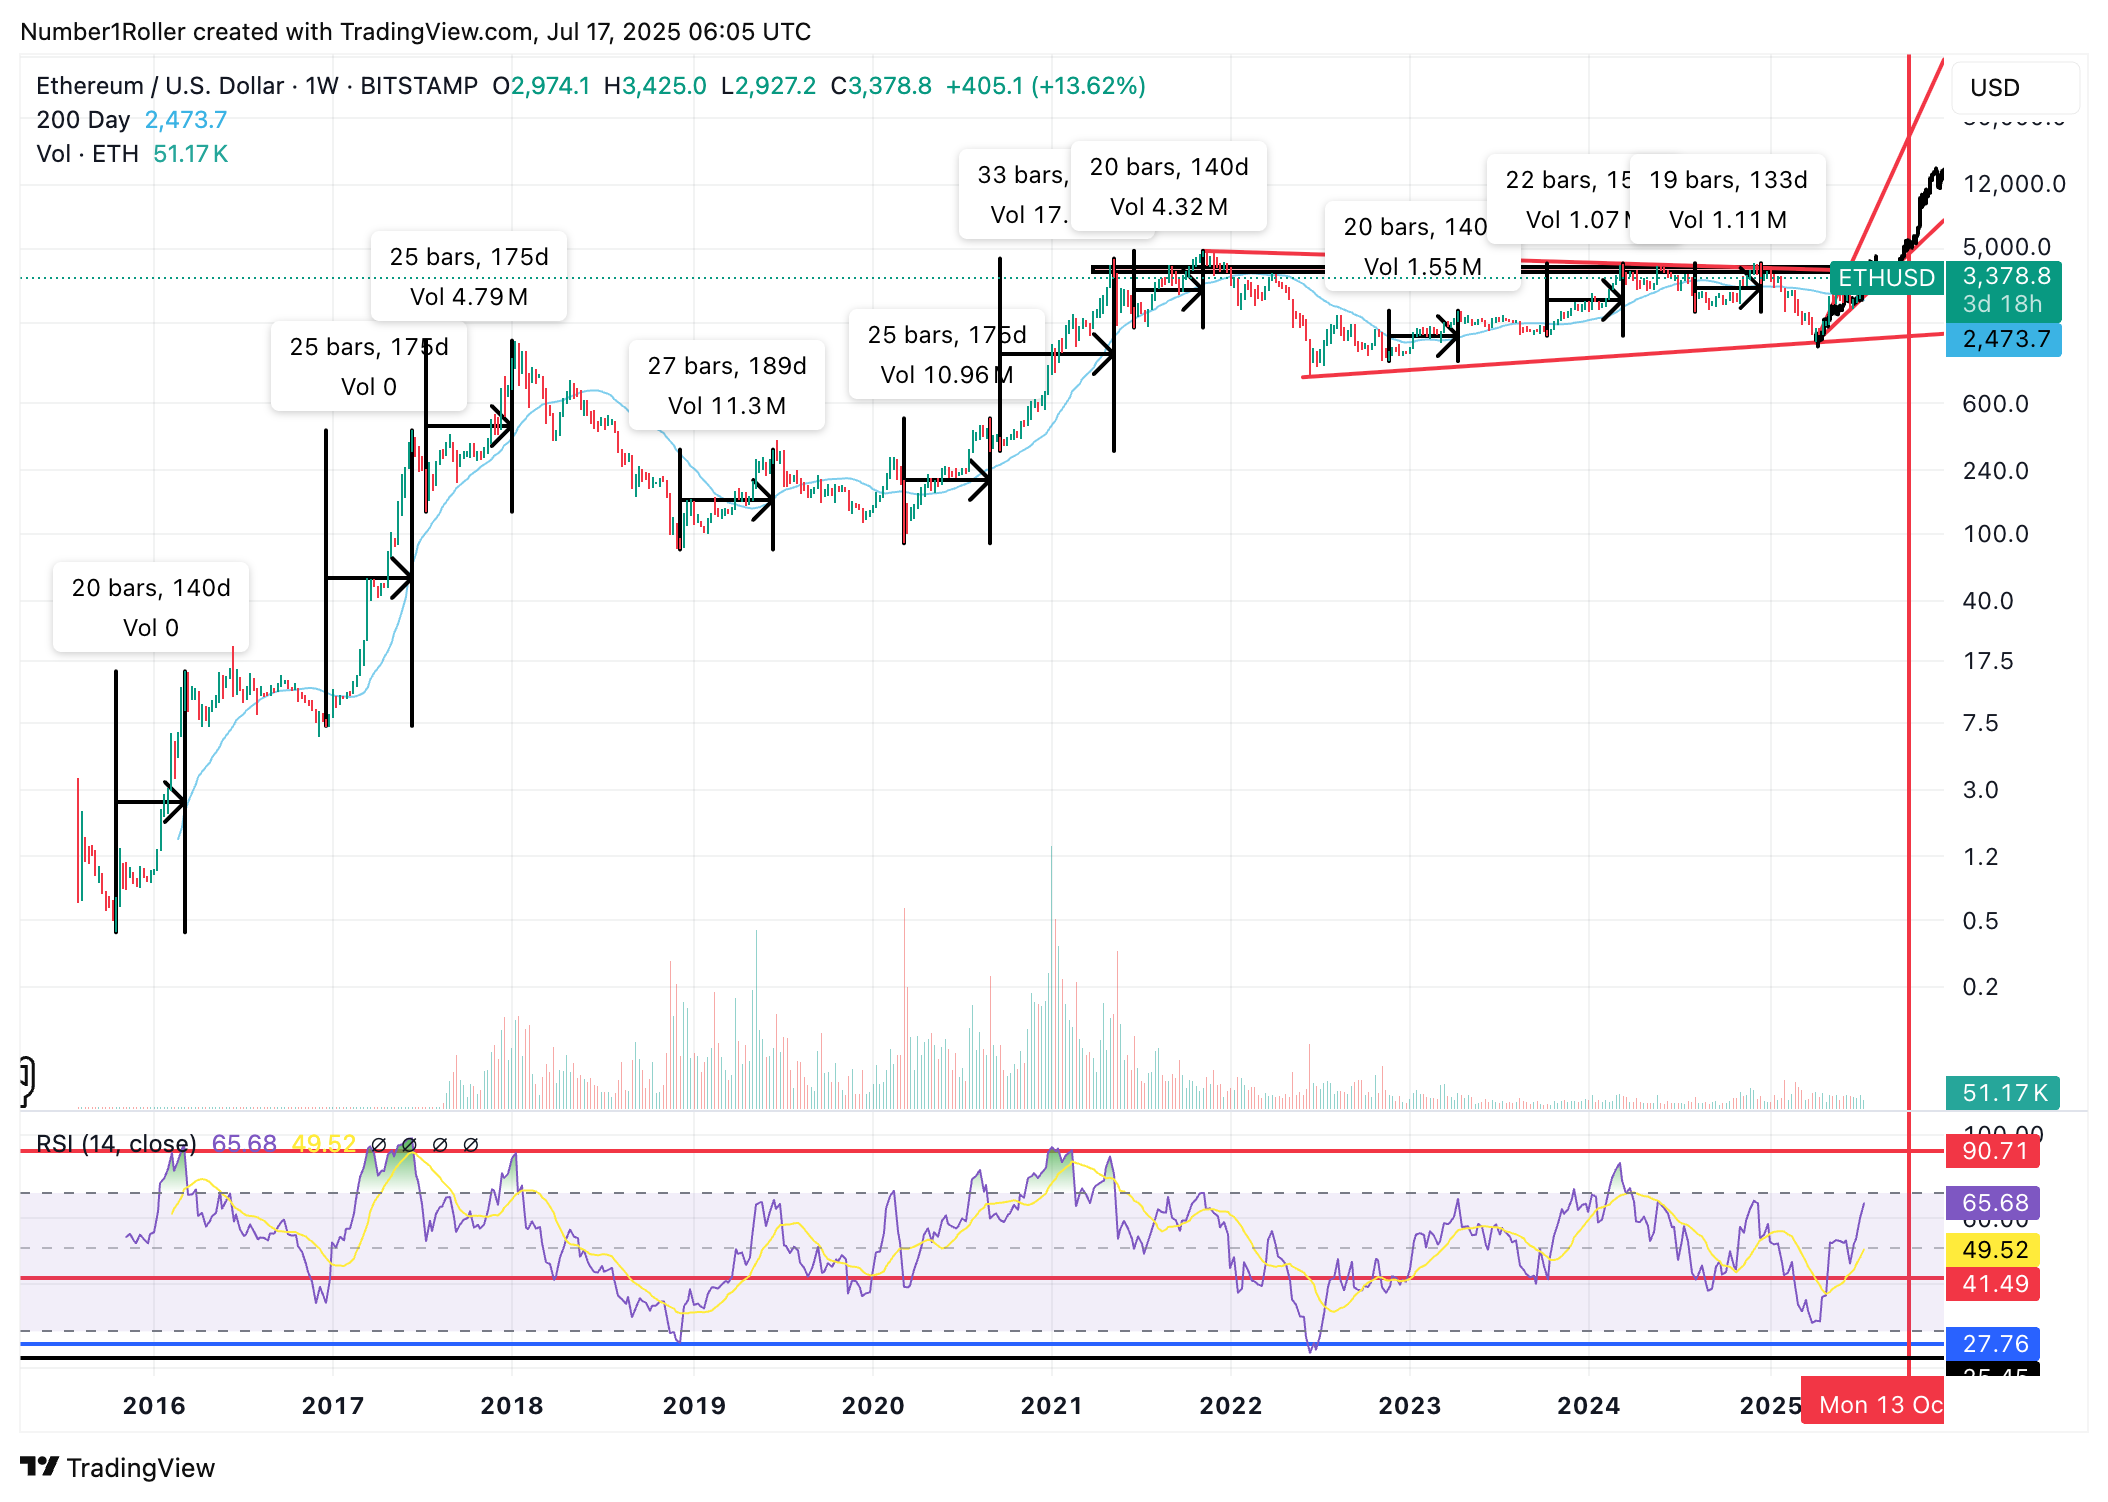
Again, very consistently we are getting 20 to 25 week run ups and that goes all the way back to 2016. This time factor is consistent with every major bullish move on ETH. But, notice often times in a very bullish market it was just a weekly correction that followed.
Seasonal Patterns
One other major aspect of dissecting a market is to look at every month and note how often a market makes a high or low in that particular month. It will give you a good probability about when to expect monthly highs, lows or reversals.
Below is the again the monthly ETH chart. Each arrow on this chart marks the month of September and each time September gave us a monthly reversal against the previous months trend.
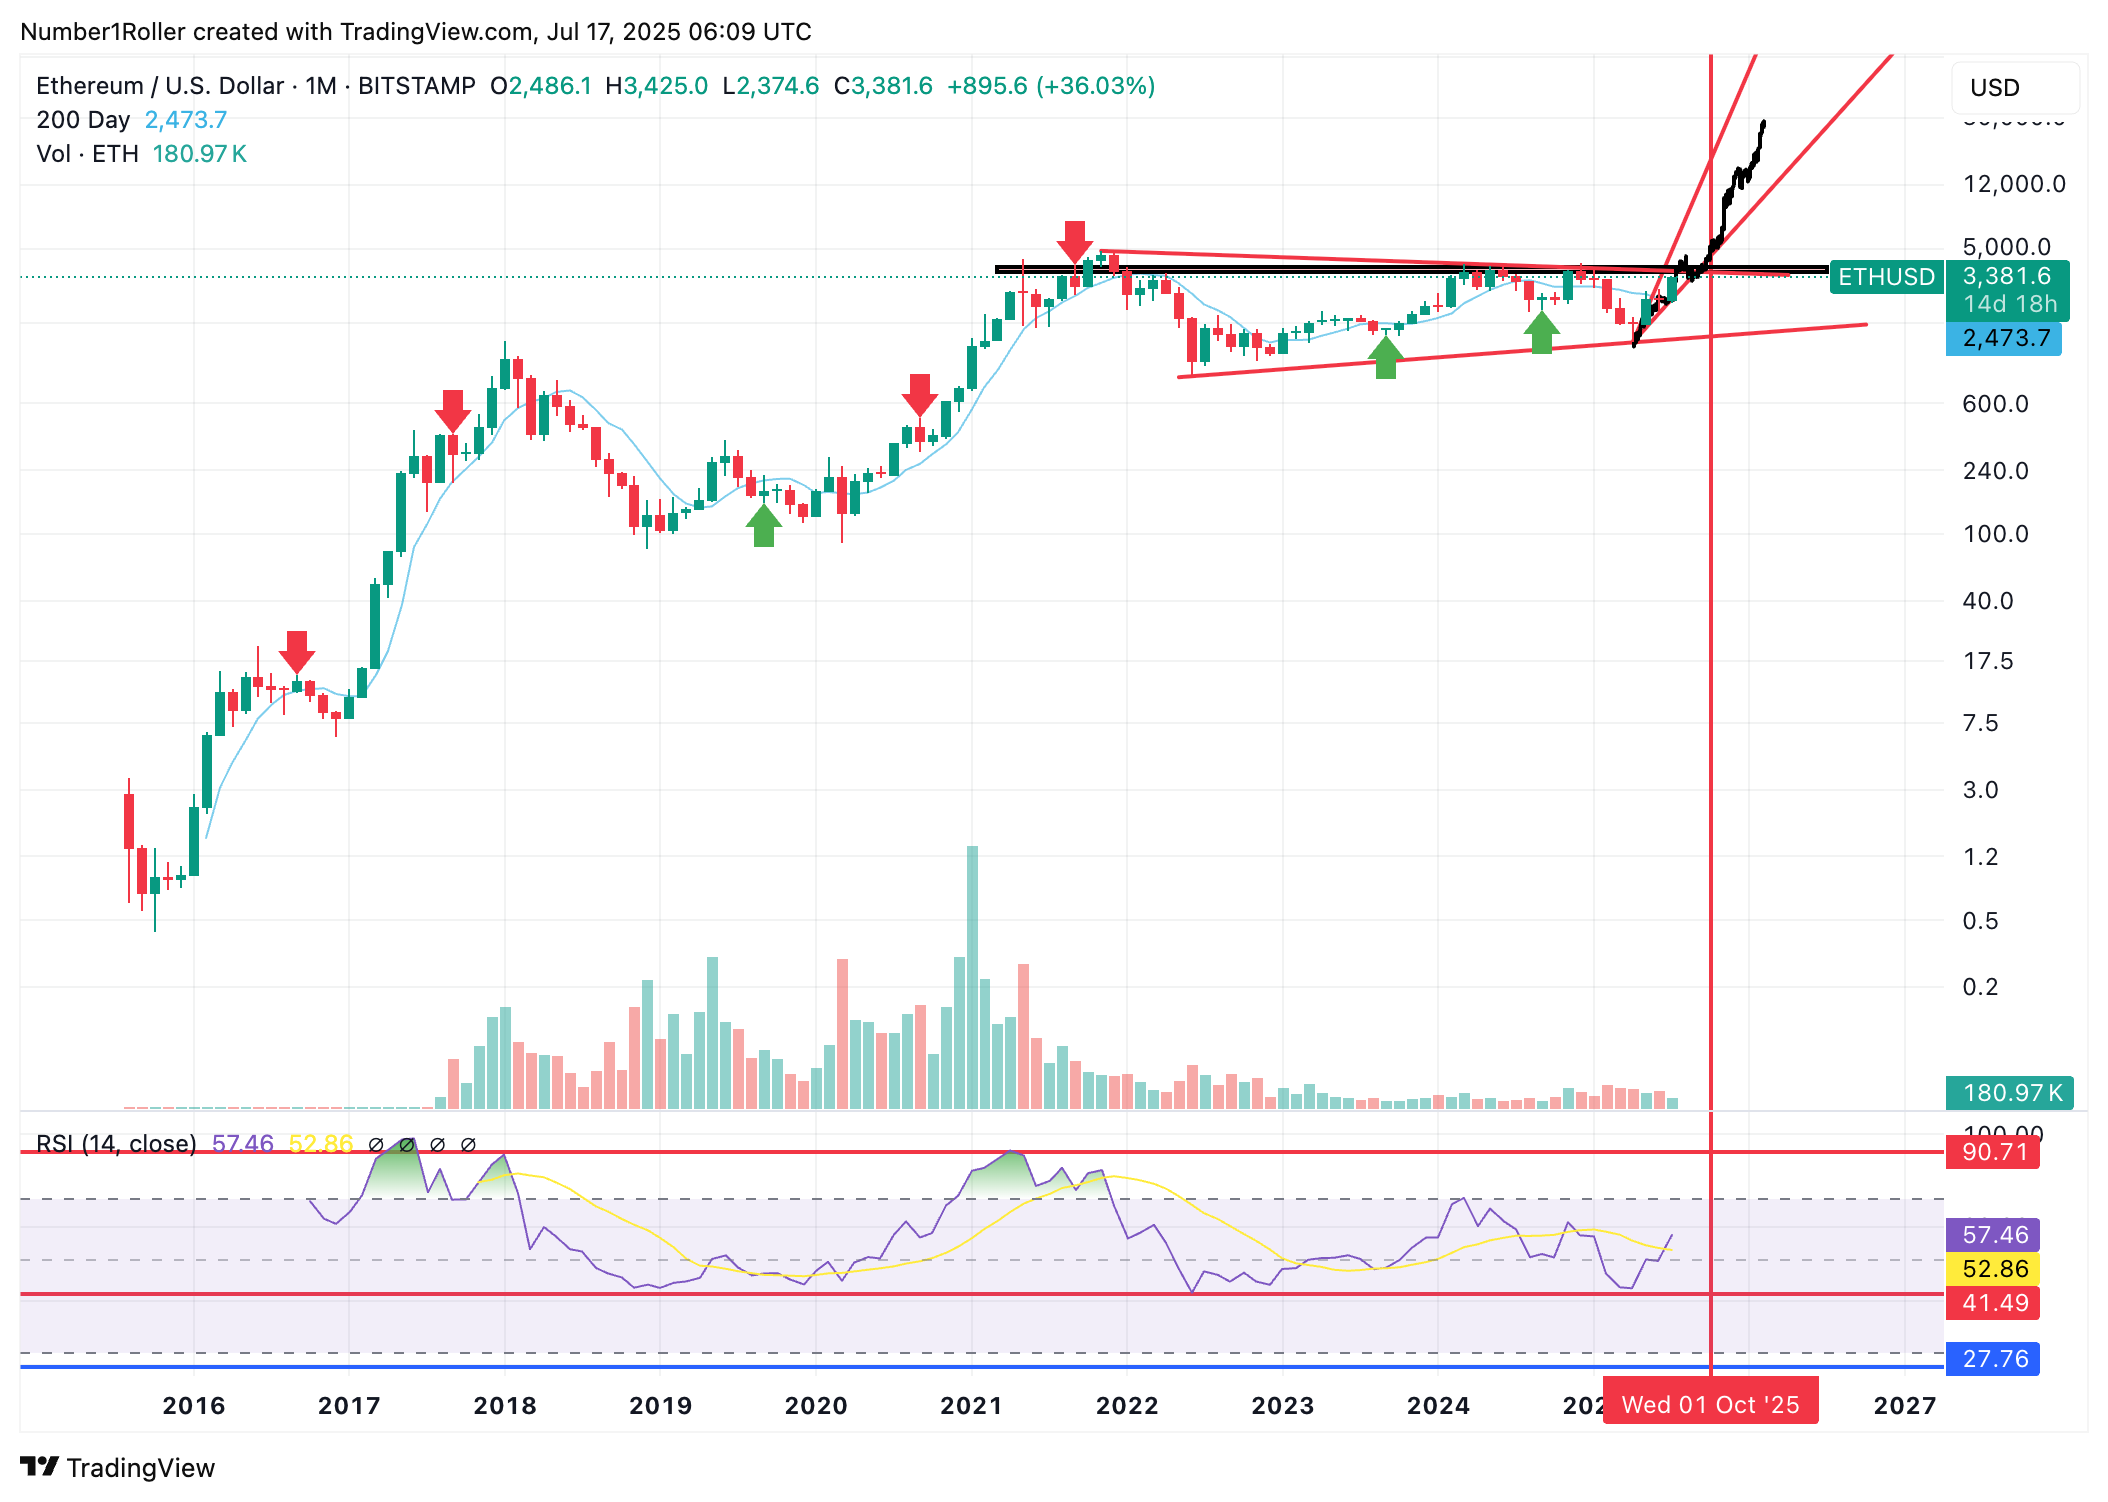
With ETH having been around for only 10 Septembers it’s very notable that 7 of them have been counter to the previous months candle. You don’t need me to do the math but thats 70% of the time we can bet that September will be a reversal month whether the trend is up or down.
Looking closer at the weekly chart below will get us zoomed in to the exact weeks this reversal typically happens.
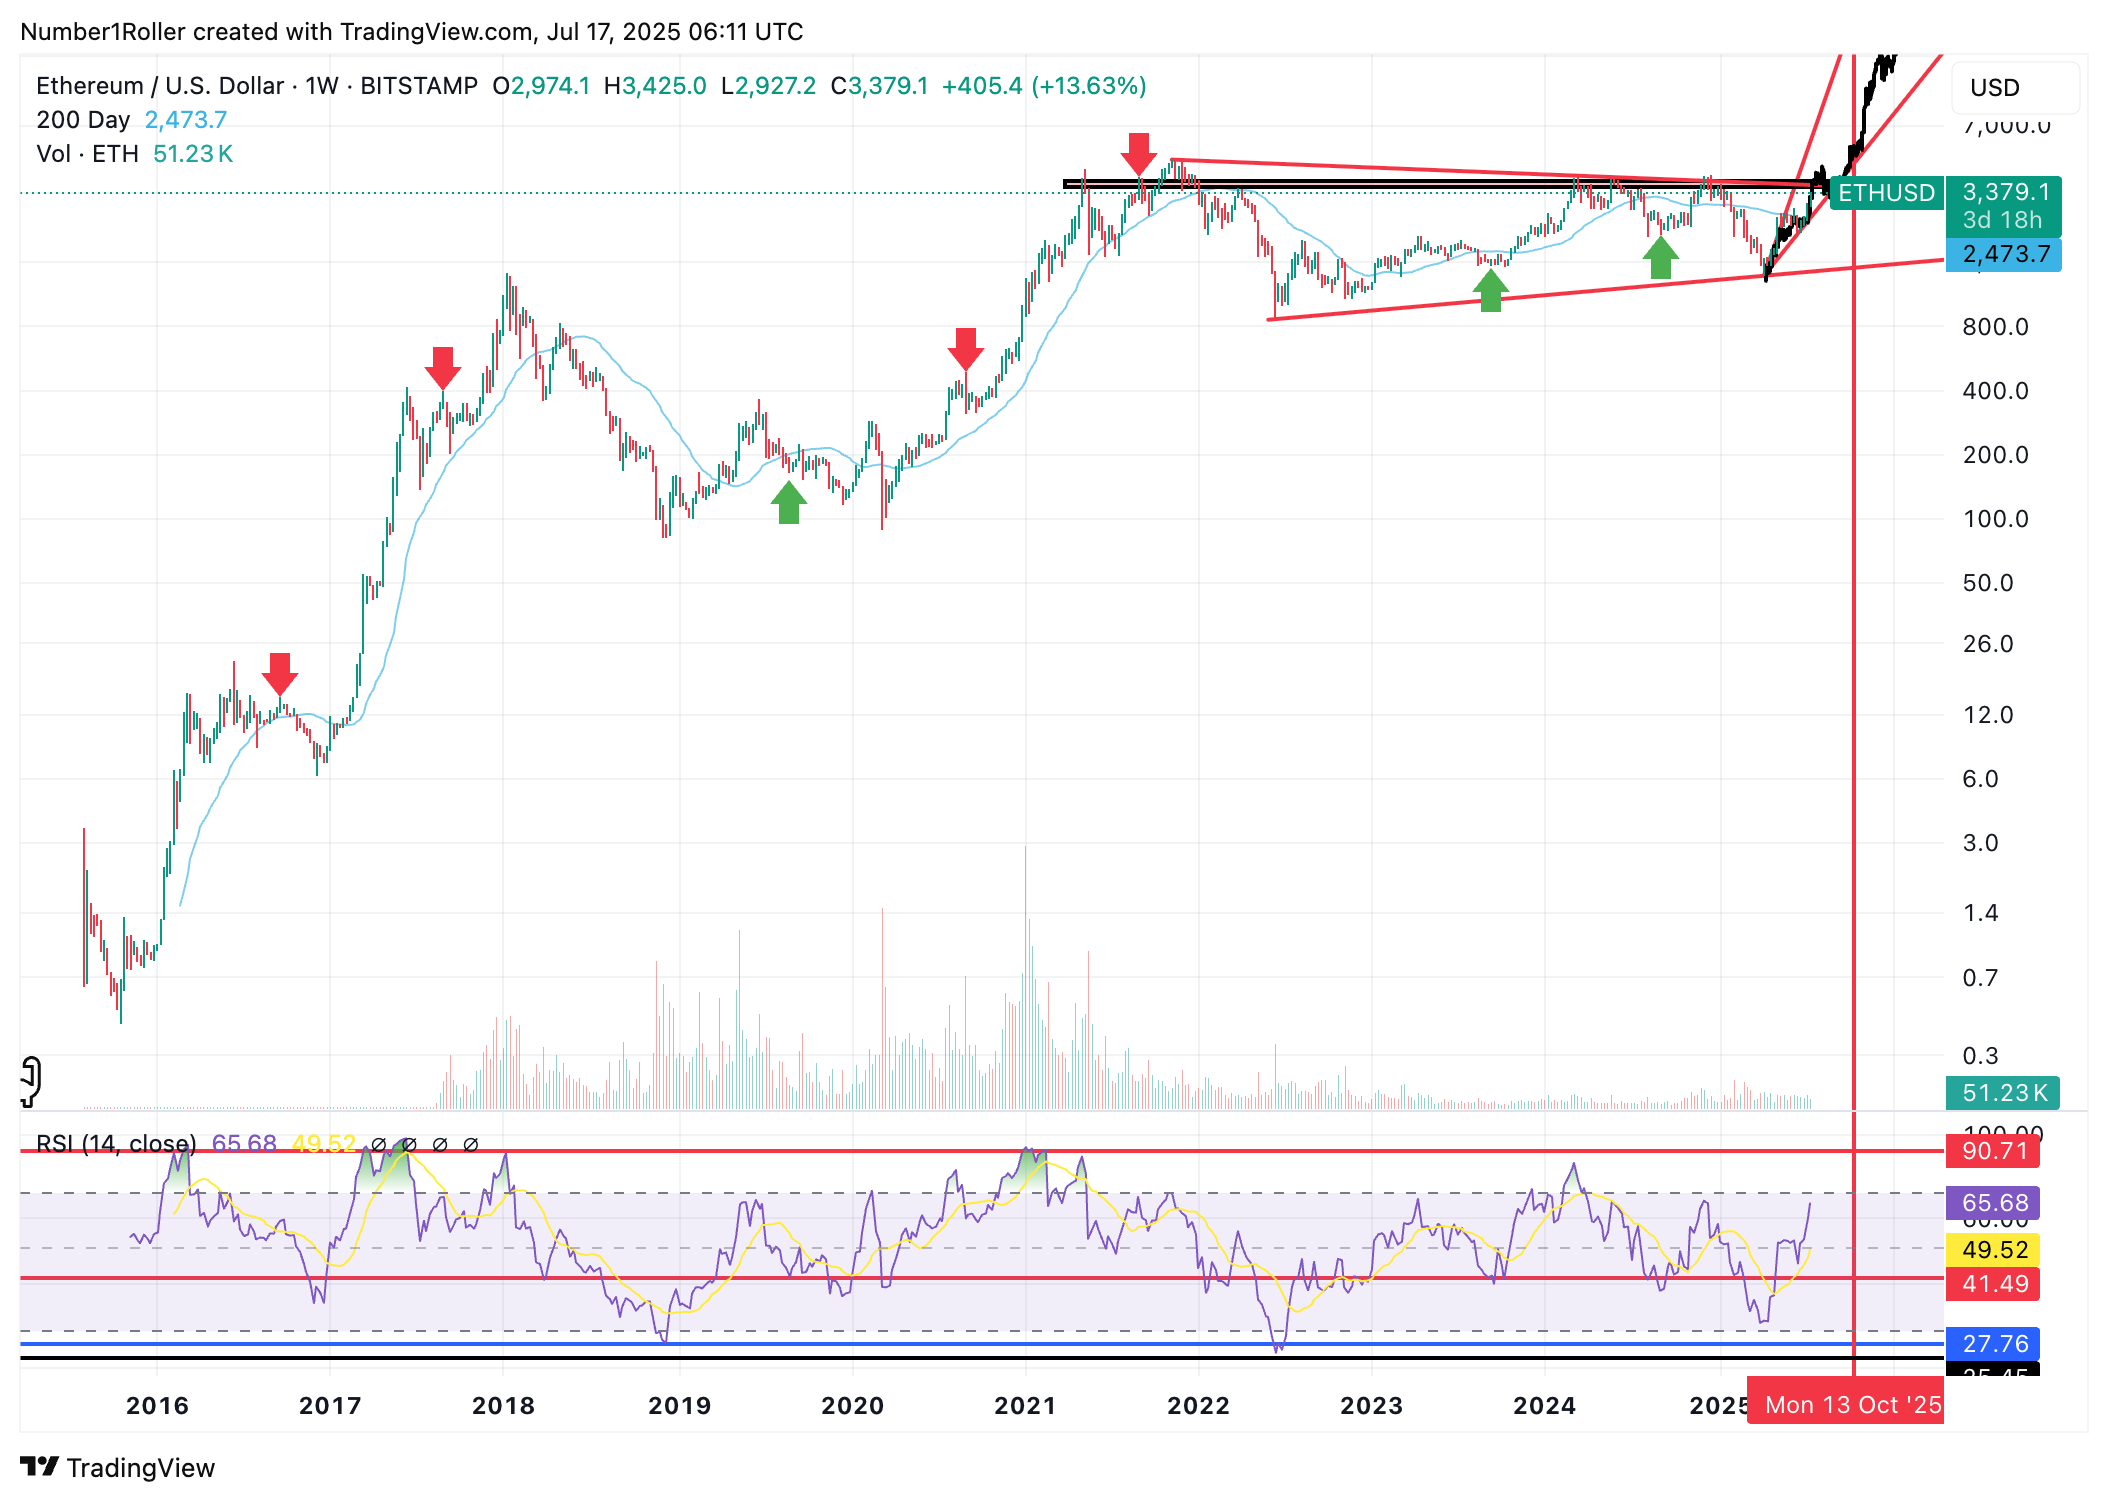
I don’t have the exact dates marked, but the times are very close to the first week of September give or take a week.
What this chart does show you is a very good picture that if ETH is moving up into September it reverses down, and if its going down into September it reverses up. (it even did it in 2022 but I don’t have that marked here.)
Today’s Move
Breaking it all down into today’s move you will get that 5 months up lands us in September.
20 weeks up gets us right into that last week of August which turns into that first week of September.
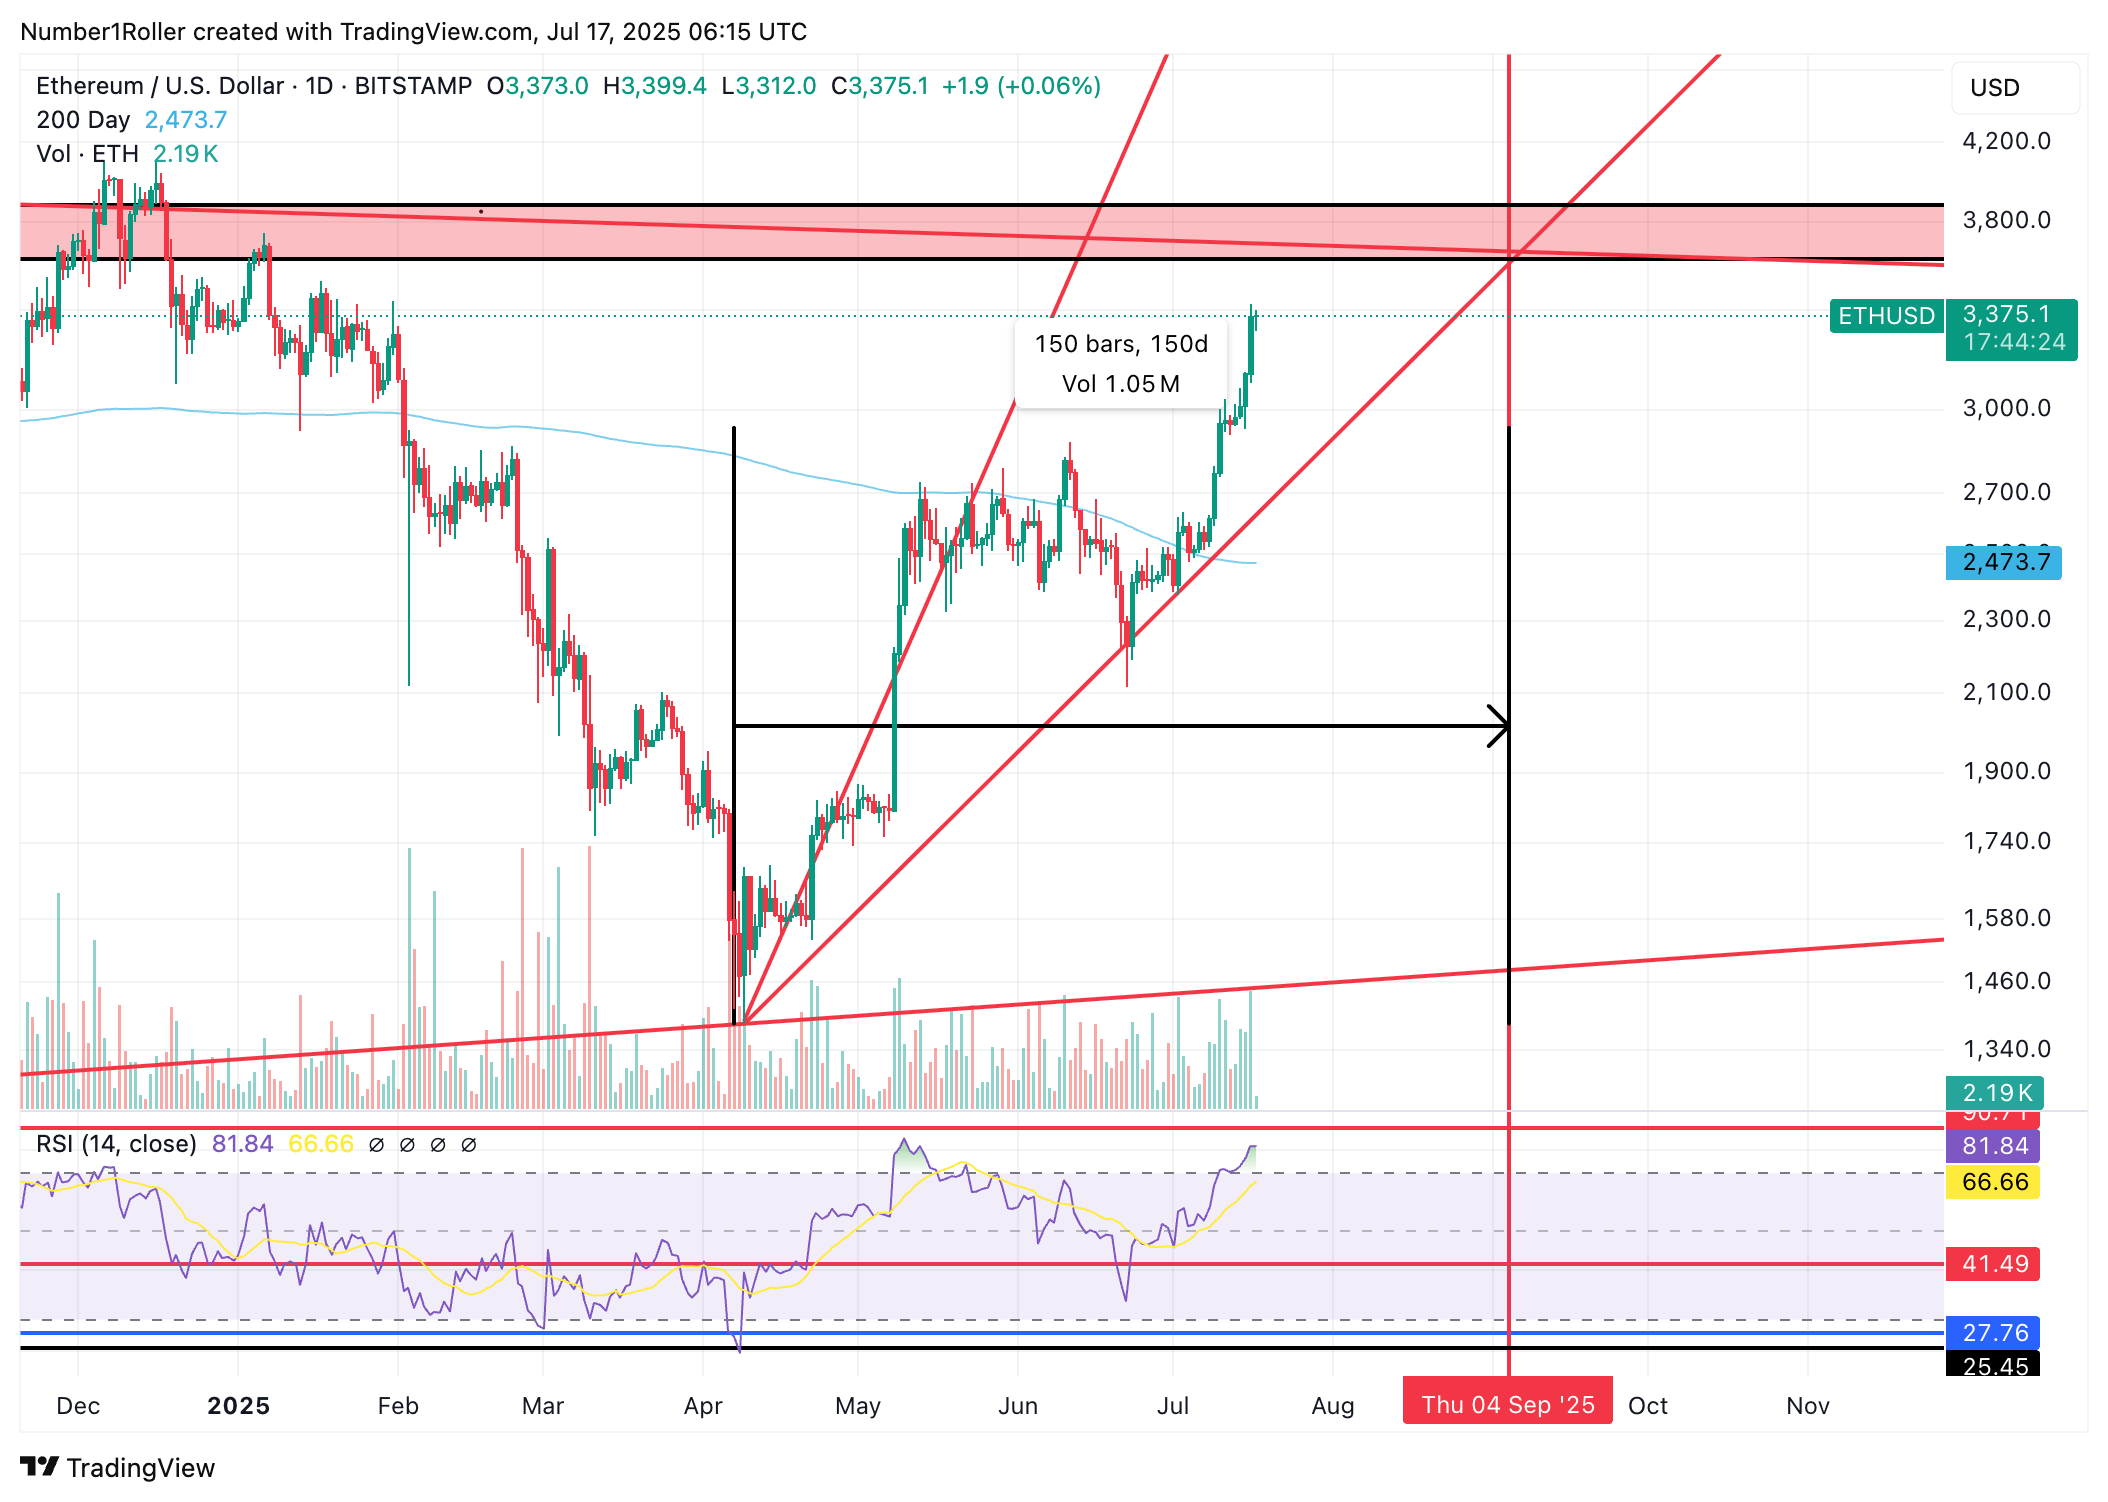
And then the daily time factor of 150 degrees from the low will fall right into September 4th.
Bringing it All Together
When looking at a market it always pays to start from a very high level with the monthly view. This smooths out the data and takes all the noise away from the daily and weekly chart giving us the major time ranges.
From that we can see that there is a high probability of a 5 to 6 month run on ETH.
Then we can break it down to our weekly (20-25 weeks) and daily charts to zoom in on our target.
This is a pure time based analysis and it clearly tells us the major date of importance for ETH is around that first week in September for a potential monthly reversal against the trend.
The caveat is that while I want us all to be aware of this potential reversal I’m not saying its the end all be all of the cycle. It’s more likely we get a weekly correction through September make a low in October and the market continues on its way up. In fact if you look at the charts again you will see that ETH has never made a major bull market high or bear market low in September.
It’s important we know these times and have plans around them on how to execute. It’s what gets us through the major panics and when everyone starts calling for 20k ETH it will be what gets us through the euphoria.
It’s pretty evident to me by these charts that we can expect a reversal in the market around that first week of September. The question becomes how significant is it. That much we will determine when we get there.
For now the two scenarios at play are:
We slow down now into the early August time factor. Then the market continues higher into this September window for a before a bigger monthly reversal lower
We rip right through to early August have a choppy month and then reverse higher again in September
Based on the monthly charts I believe August will be a great month. Its possible September is a good month as well and we get the 6 month run instead of the 5 month run. But either way as we have been saying for months now, the first week of September is the first big window to watch for a significant weekly correction and red month. If we get through that unscathed then we can think more about October but at that point I would be more cautious. Until then this analysis strongly suggest we have at minimum a very good 4-6 weeks left in the tank before a cool down period.
Thank you for the thorough and useful analysis.