
Bitcoin Bottom or Bear Market?
The crypto market is extremely divided right now. Half the crowd is screaming “bear market confirmed, one-year post-peak meltdown incoming,” while the other half is paying attention to real signals.
I’m in the second camp, and today I’m going to show you exactly why this dip isn’t the start of some dreaded extended bear it’s the final major low of the entire cycle.
I’ve called every single important bottom this cycle with the same toolkit, and it’s never been louder than it is right now.
While most are trapped in the oversimplified “four-year cycle” meme and nothing else, you already know there are far bigger, far more dominant timeframes running the show.
The four-year cycle isn’t wrong it’s just a tiny cog inside a much larger machine most people can’t even see.
Context is everything. Conditions are everything. And right now, every single layer of Gann analysis we rely on: time cycles, market structure, price levels, seasonal turns, and perfect time/price squares is saying the same thing—we are at the pivot.
Let me prove it to you with five interlocking pieces that have never failed us once this cycle.
The Cycle of 7 hitting from every angle (7 years, 7 months, 7 weeks, 7 days)
Market structure that’s actually getting stronger, not weaker
The one Gann price level (0.375) that has caught every major low this cycle
A stack of seasonal anniversary dates and 225°/45-day turns all converging this week
Multiple time/price squares nailing the exact day and price zone we just tagged
This isn’t hope or speculation. This is pure market geometry and time lining up in a way that only happens at the most important turning points.
The market has done its job by shaking out the weak hands, flipped the sentiment ice-cold, and convinced 90% of participants that the bull is dead. That’s exactly what it’s supposed to do right before the real move starts. By the time you finish this piece you’re going to see this low the same way we do—as the inflection point that sends this Bitcoin cycle into 2026.
Cycle of 7
The first cycle to consider here is the 7 year cycle which can be broken down into a 7 month, 7 week, or 7 day cycle. Last week I shared this same view on the ETH cycle and now we are going to take a look at it on BTC.
The below image is one of Ganns cycle rules on why the number 7 is of so much importance in a market.

We can look at the monthly chart to see how this translates.
As you can see below, 84 months is 7 years and every 84 months we have seen a major low. Taking the midpoint of this cycle at 42 months has also given us a low to low cycle.

When we zoom into this cycle we can also measure the time frames from monthly low to monthly low and we see that each monthly low has come in right at the 7 month mark from the last major low.

Lastly, we can see on the weekly cycles that the market did in fact decline for 7 weeks (45 days) which Gann says to watch this time period for daily and weekly corrections to culminate.
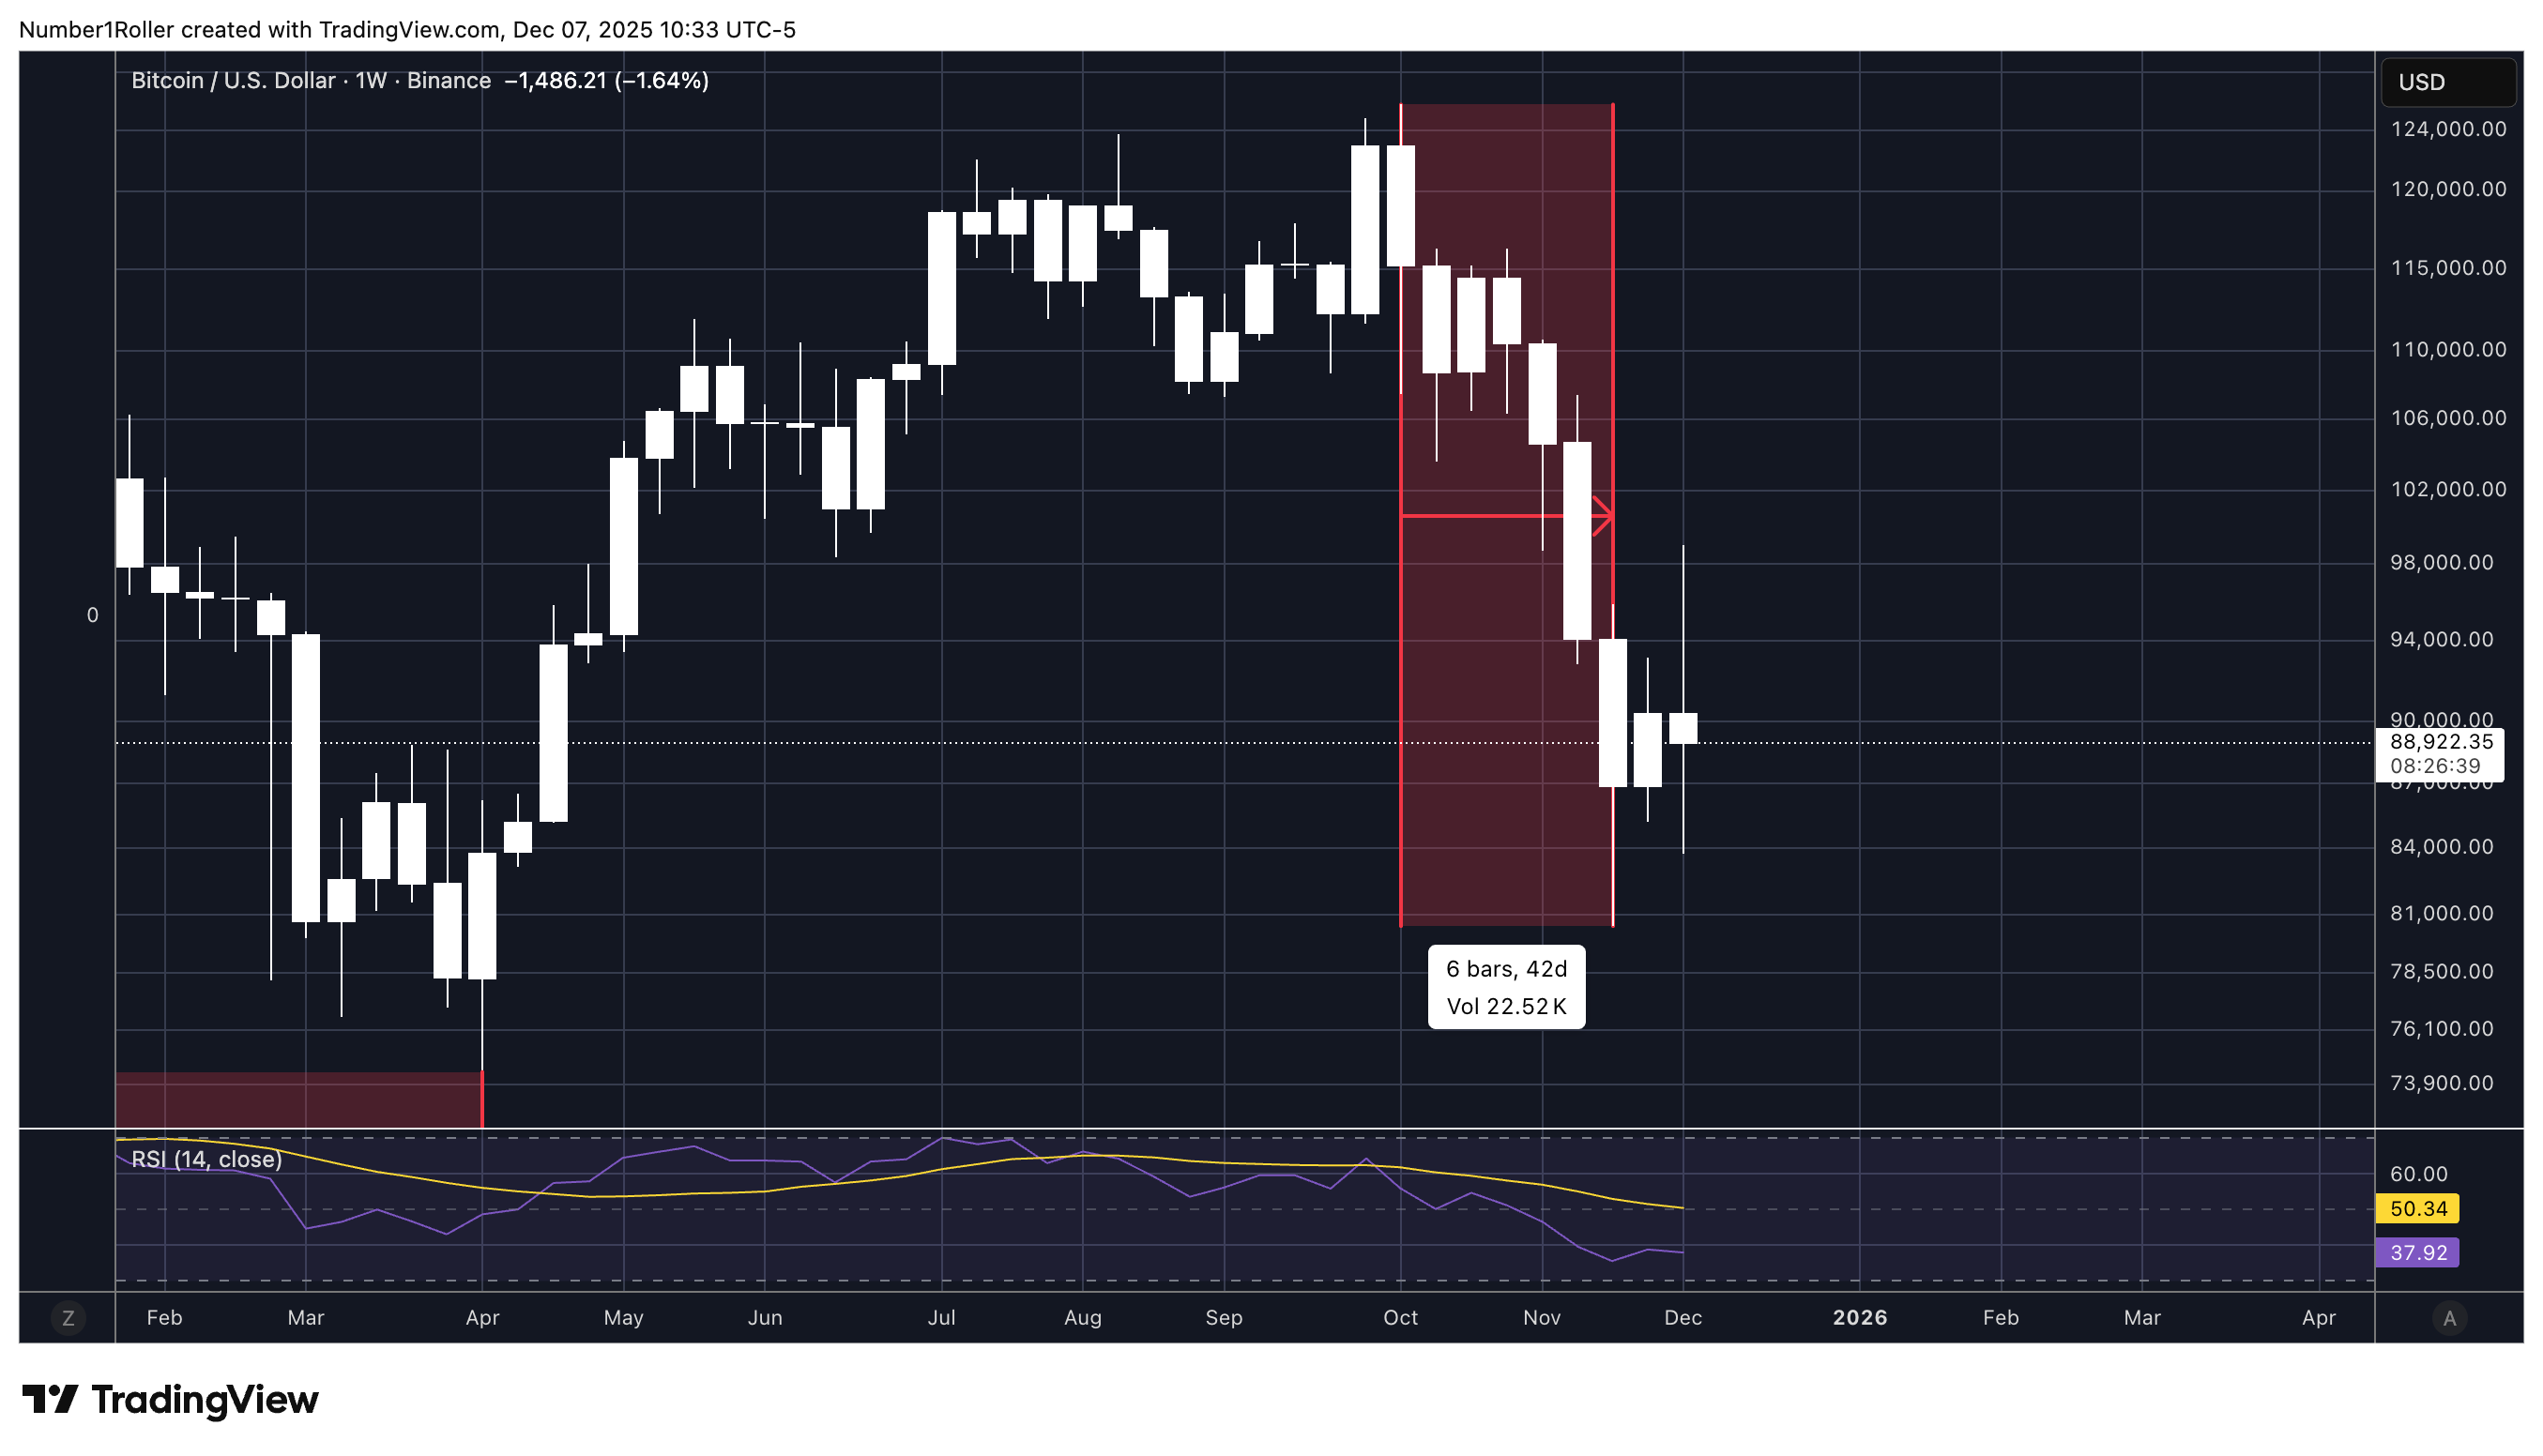
All said, we can see a the cycles of 7 coming together from the monthly down to the daily suggesting that this is an important inflection point in this market.
Market Structure and Price Levels
A lot of people talk about market structure and higher highs and lower lows but few people actually understand it. Similar to the four year cycle crowd its all they know, they don’t actually understand cycles, or what they mean.
People that think this market structure has turned bearish do not actually know what market structure is or how to judge it.
Gann always emphasized that the most important indication of a change in trend is TIME.
In a bull market the price will run up for longer periods of time than it runs down. Not only that, but the time a market runs down will not exceed the previous run down. This is what we call balancing time.
When the length of down moves in a market continually get shorter the market is a signaling strength.
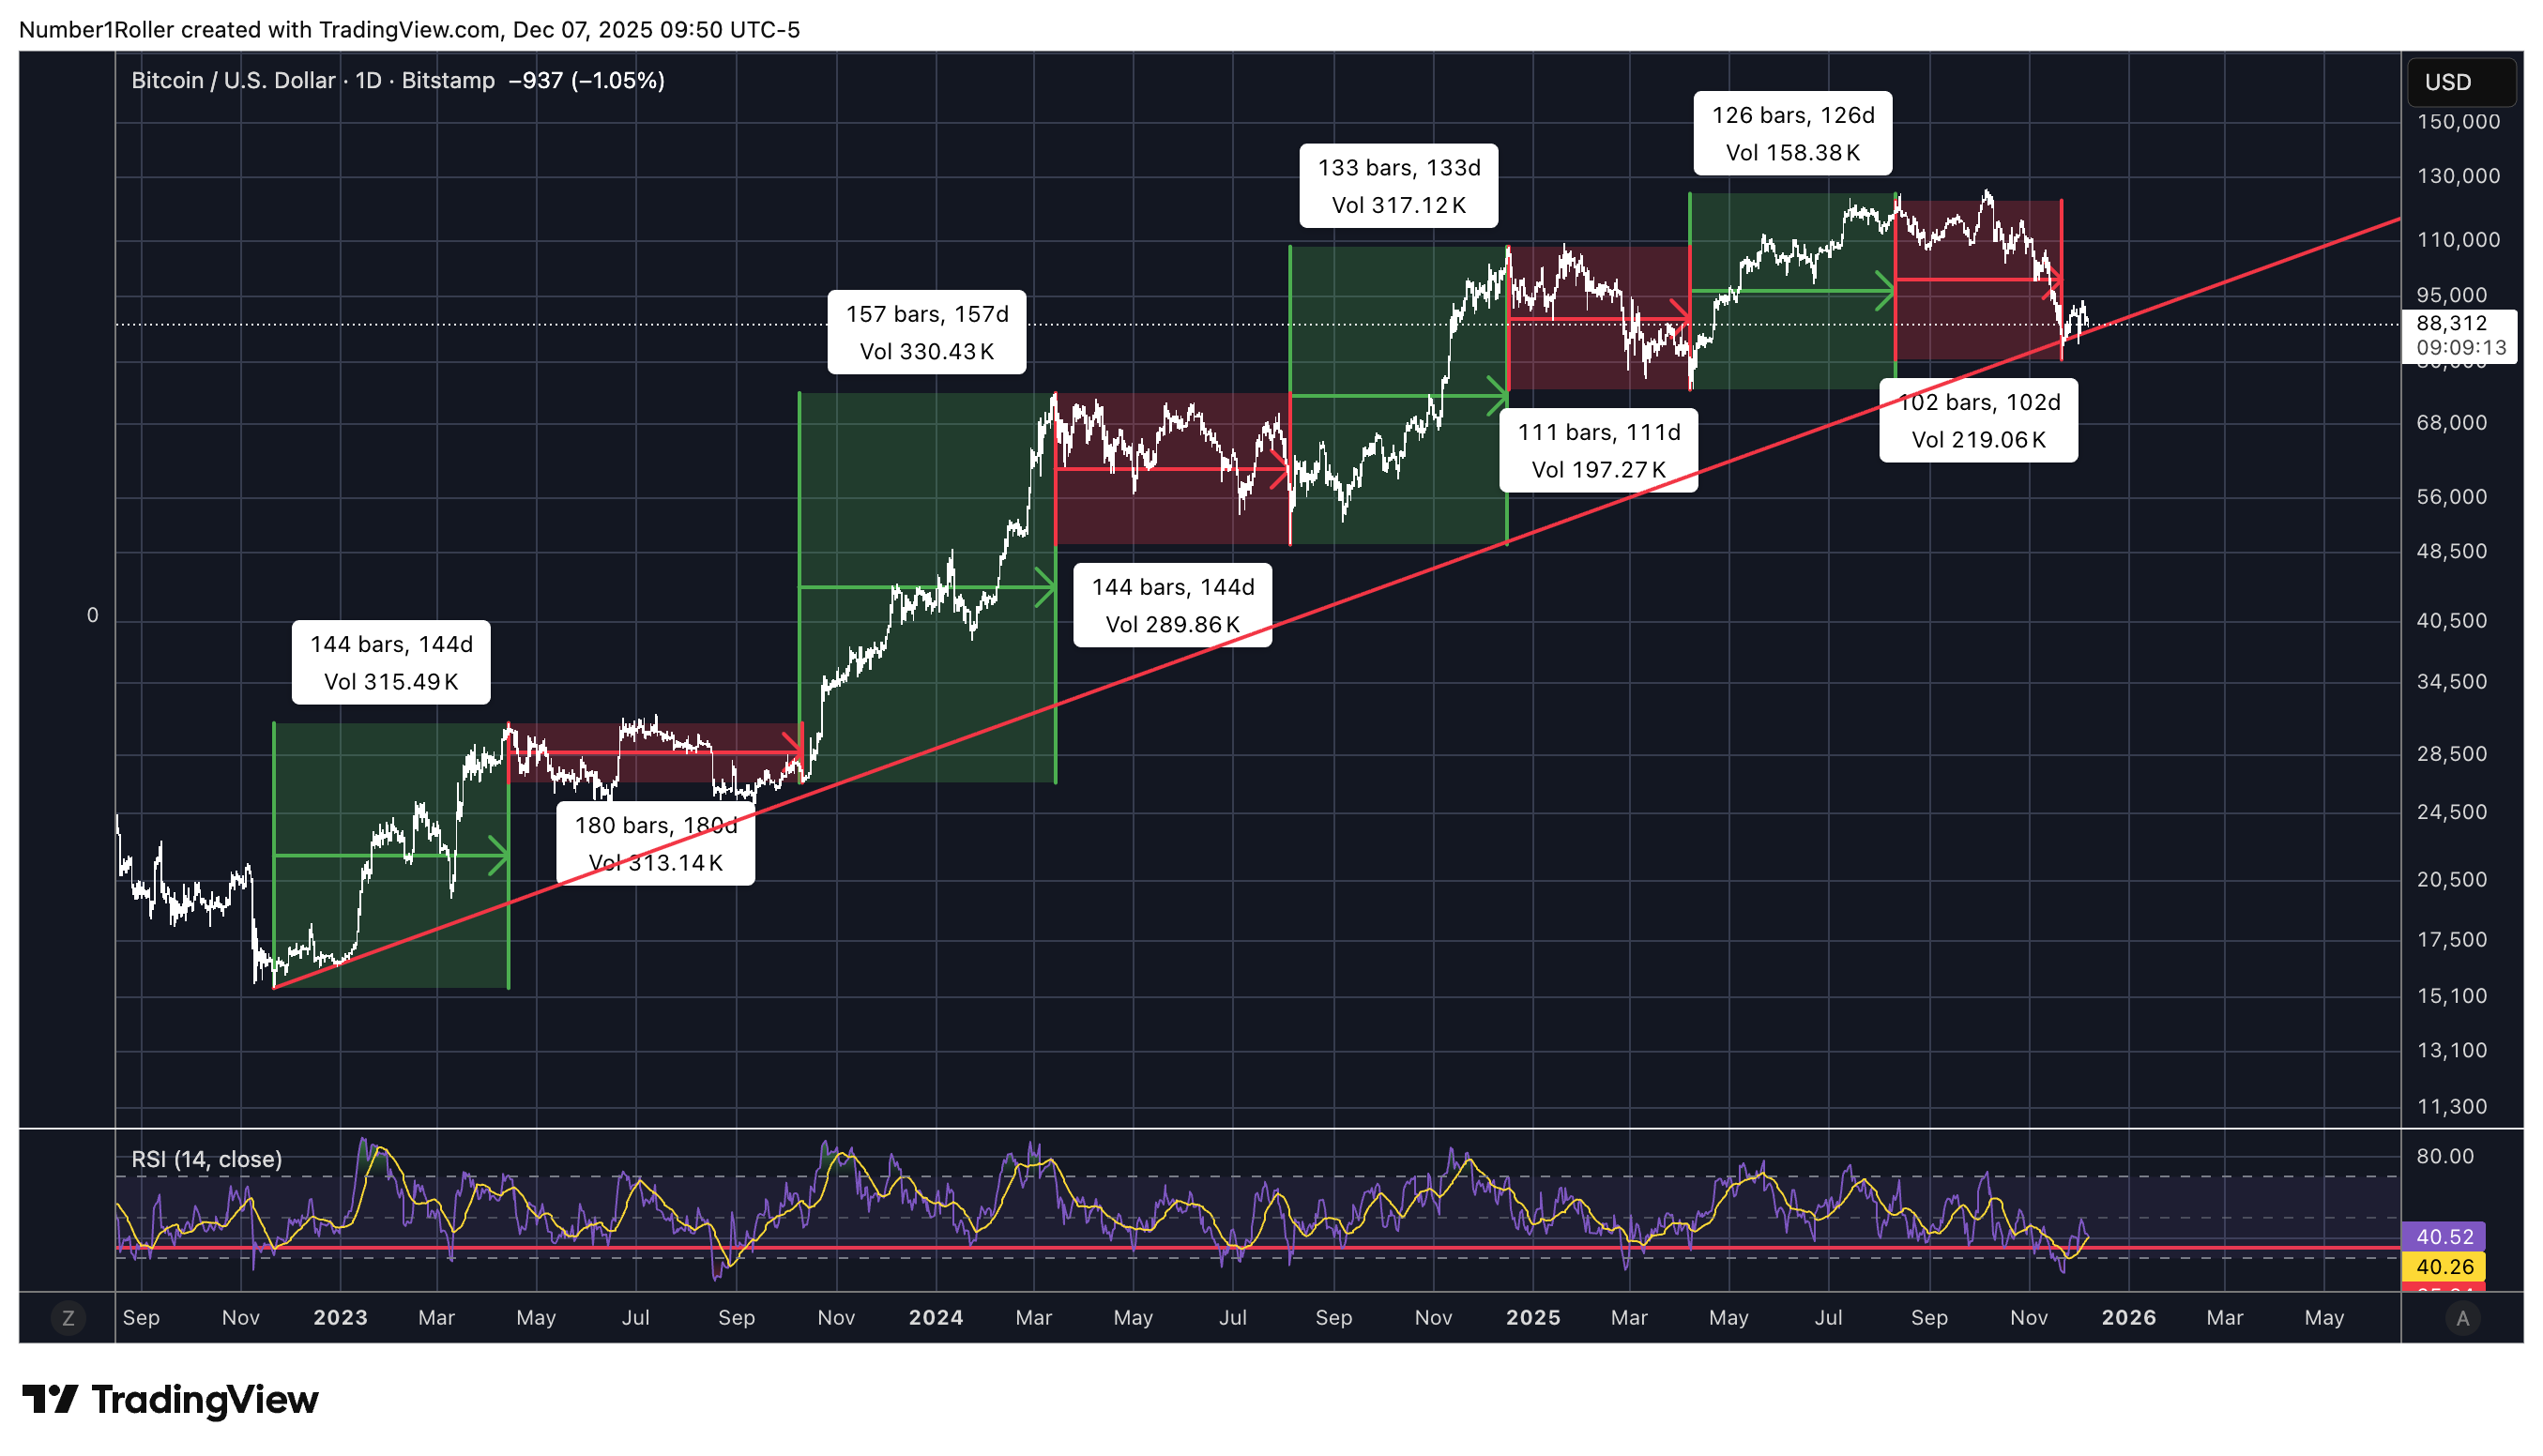
Look at the length of corrections this cycle they have continually been shorter and shorter indicating that the trend has not signaled change and the market is actually showing strength.
Then we can talk about corrections in price. Here is a clip from “45 Years in Wall Street” by Gann.
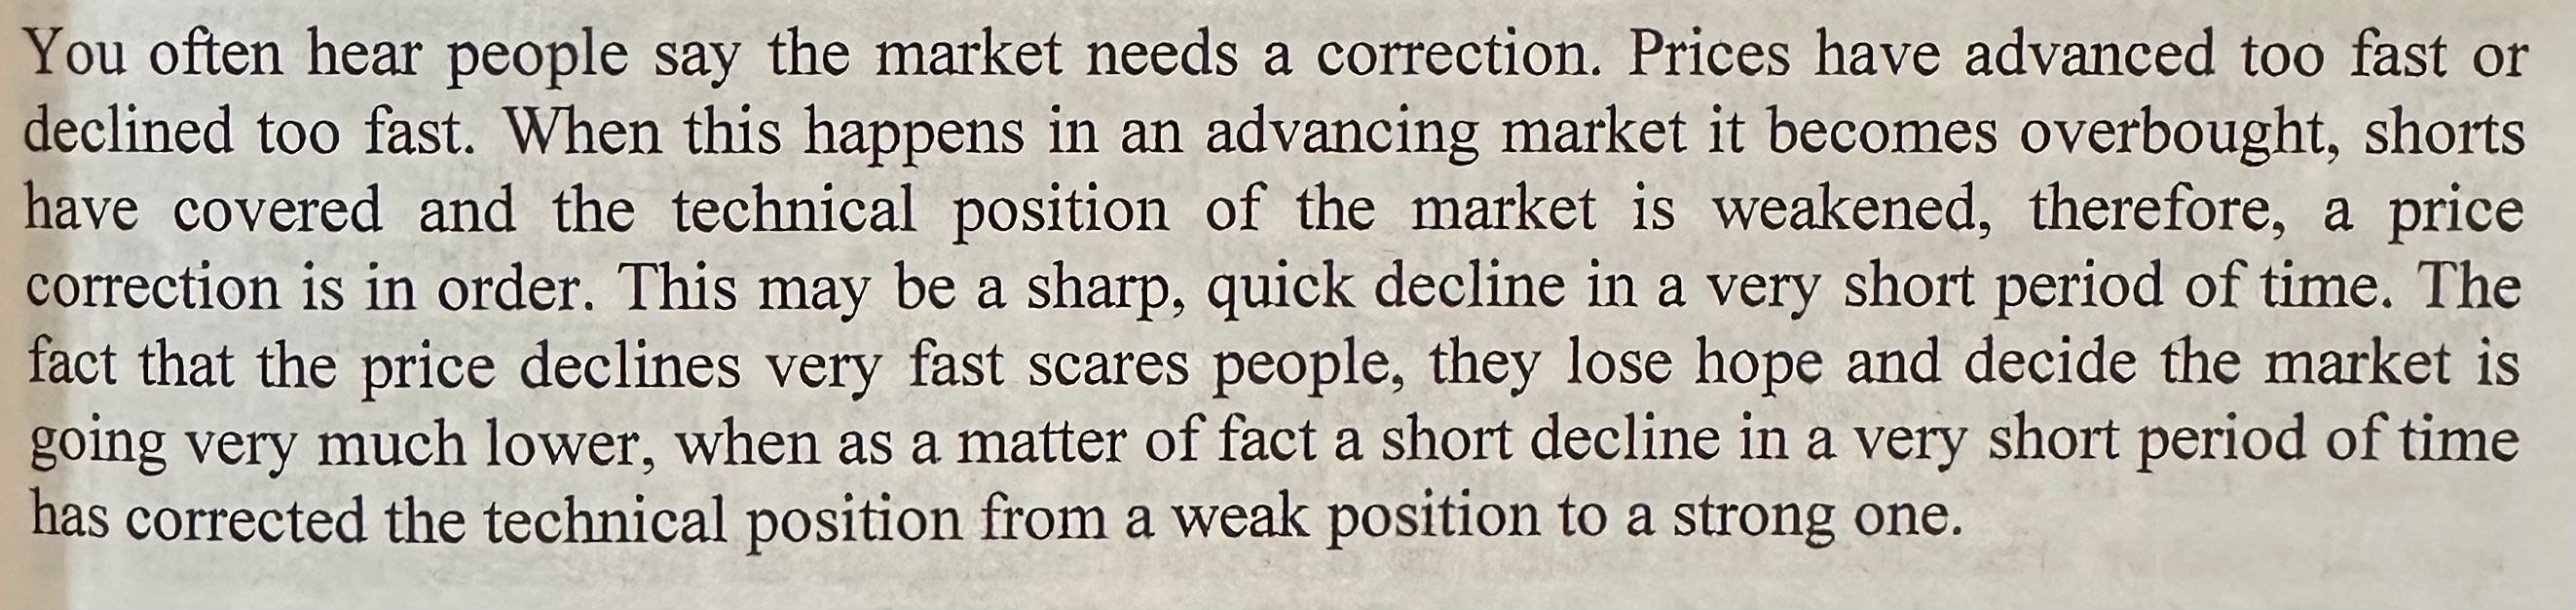
What people are missing in this latest correction is exactly the above. If you go back over the previous BTC cycles the corrections as we progressed through the cycle become increasingly violent in price but of less length in time. This is a sign of a strong market that is getting more volatile as it approaches a peak.
The below chart shows this is exactly what is happening in this structure, sharper and sharper pull backs but of shorter and shorter duration.

Price Levels
Measuring price retracements from the cycle low there is one key support level that has held all cycle long and continues to be a major factor at every low.
That level is the 0.375 Gann level. Gann divided price movements into eighths rather than using the typical fib levels.
In this case we can see how this level has marked the bottom off every major high so far from 2023 on.
2023 top

2024 top

January 2025 top

October 2025 top

Each time price has reached this level off a major top, it has been the bottom. This time that level came up at 84,420 and the price held and closed above it on the weekly.
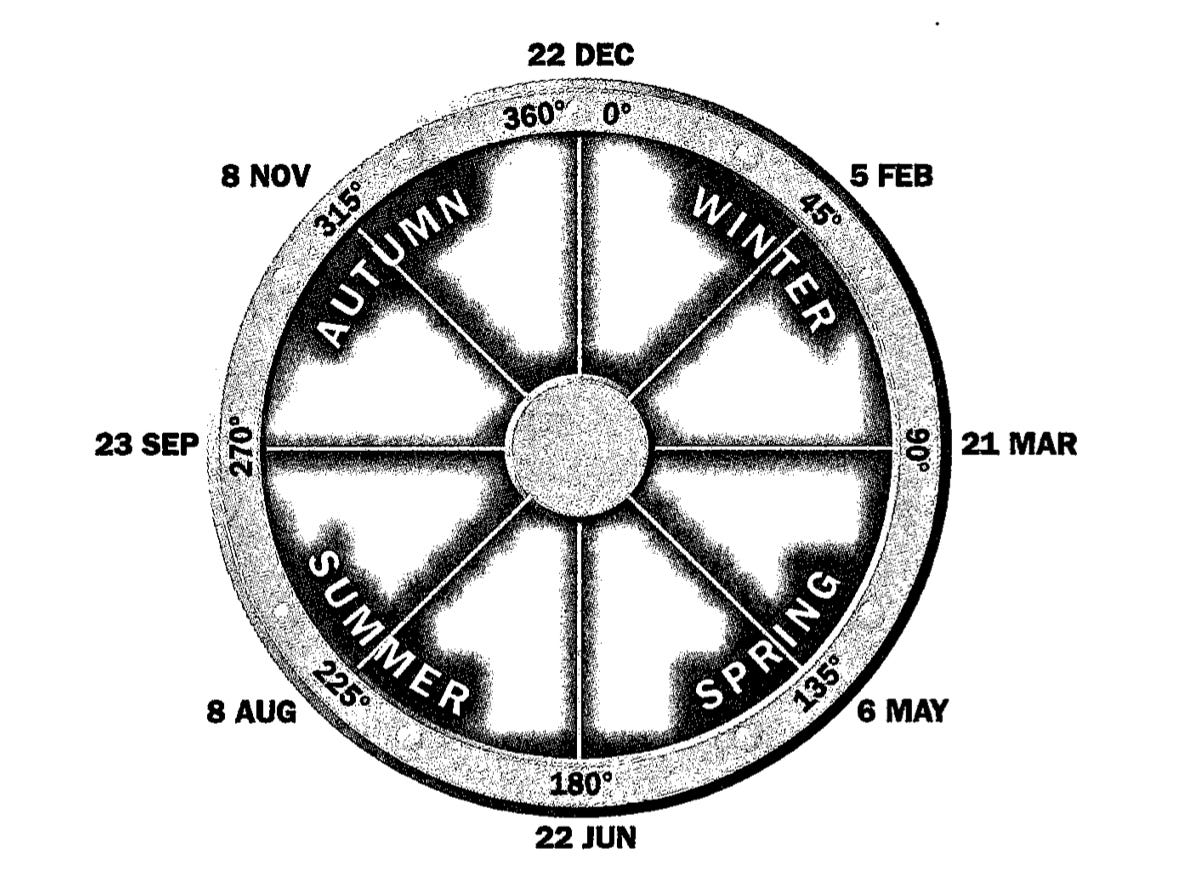
Seasonal Patterns
Next we have some strong seasonal times to consider.
The first is the Major high that came in on December 17th of last year. That is a 360 degree date and an anniversary date that comes up again on the 12th of December.
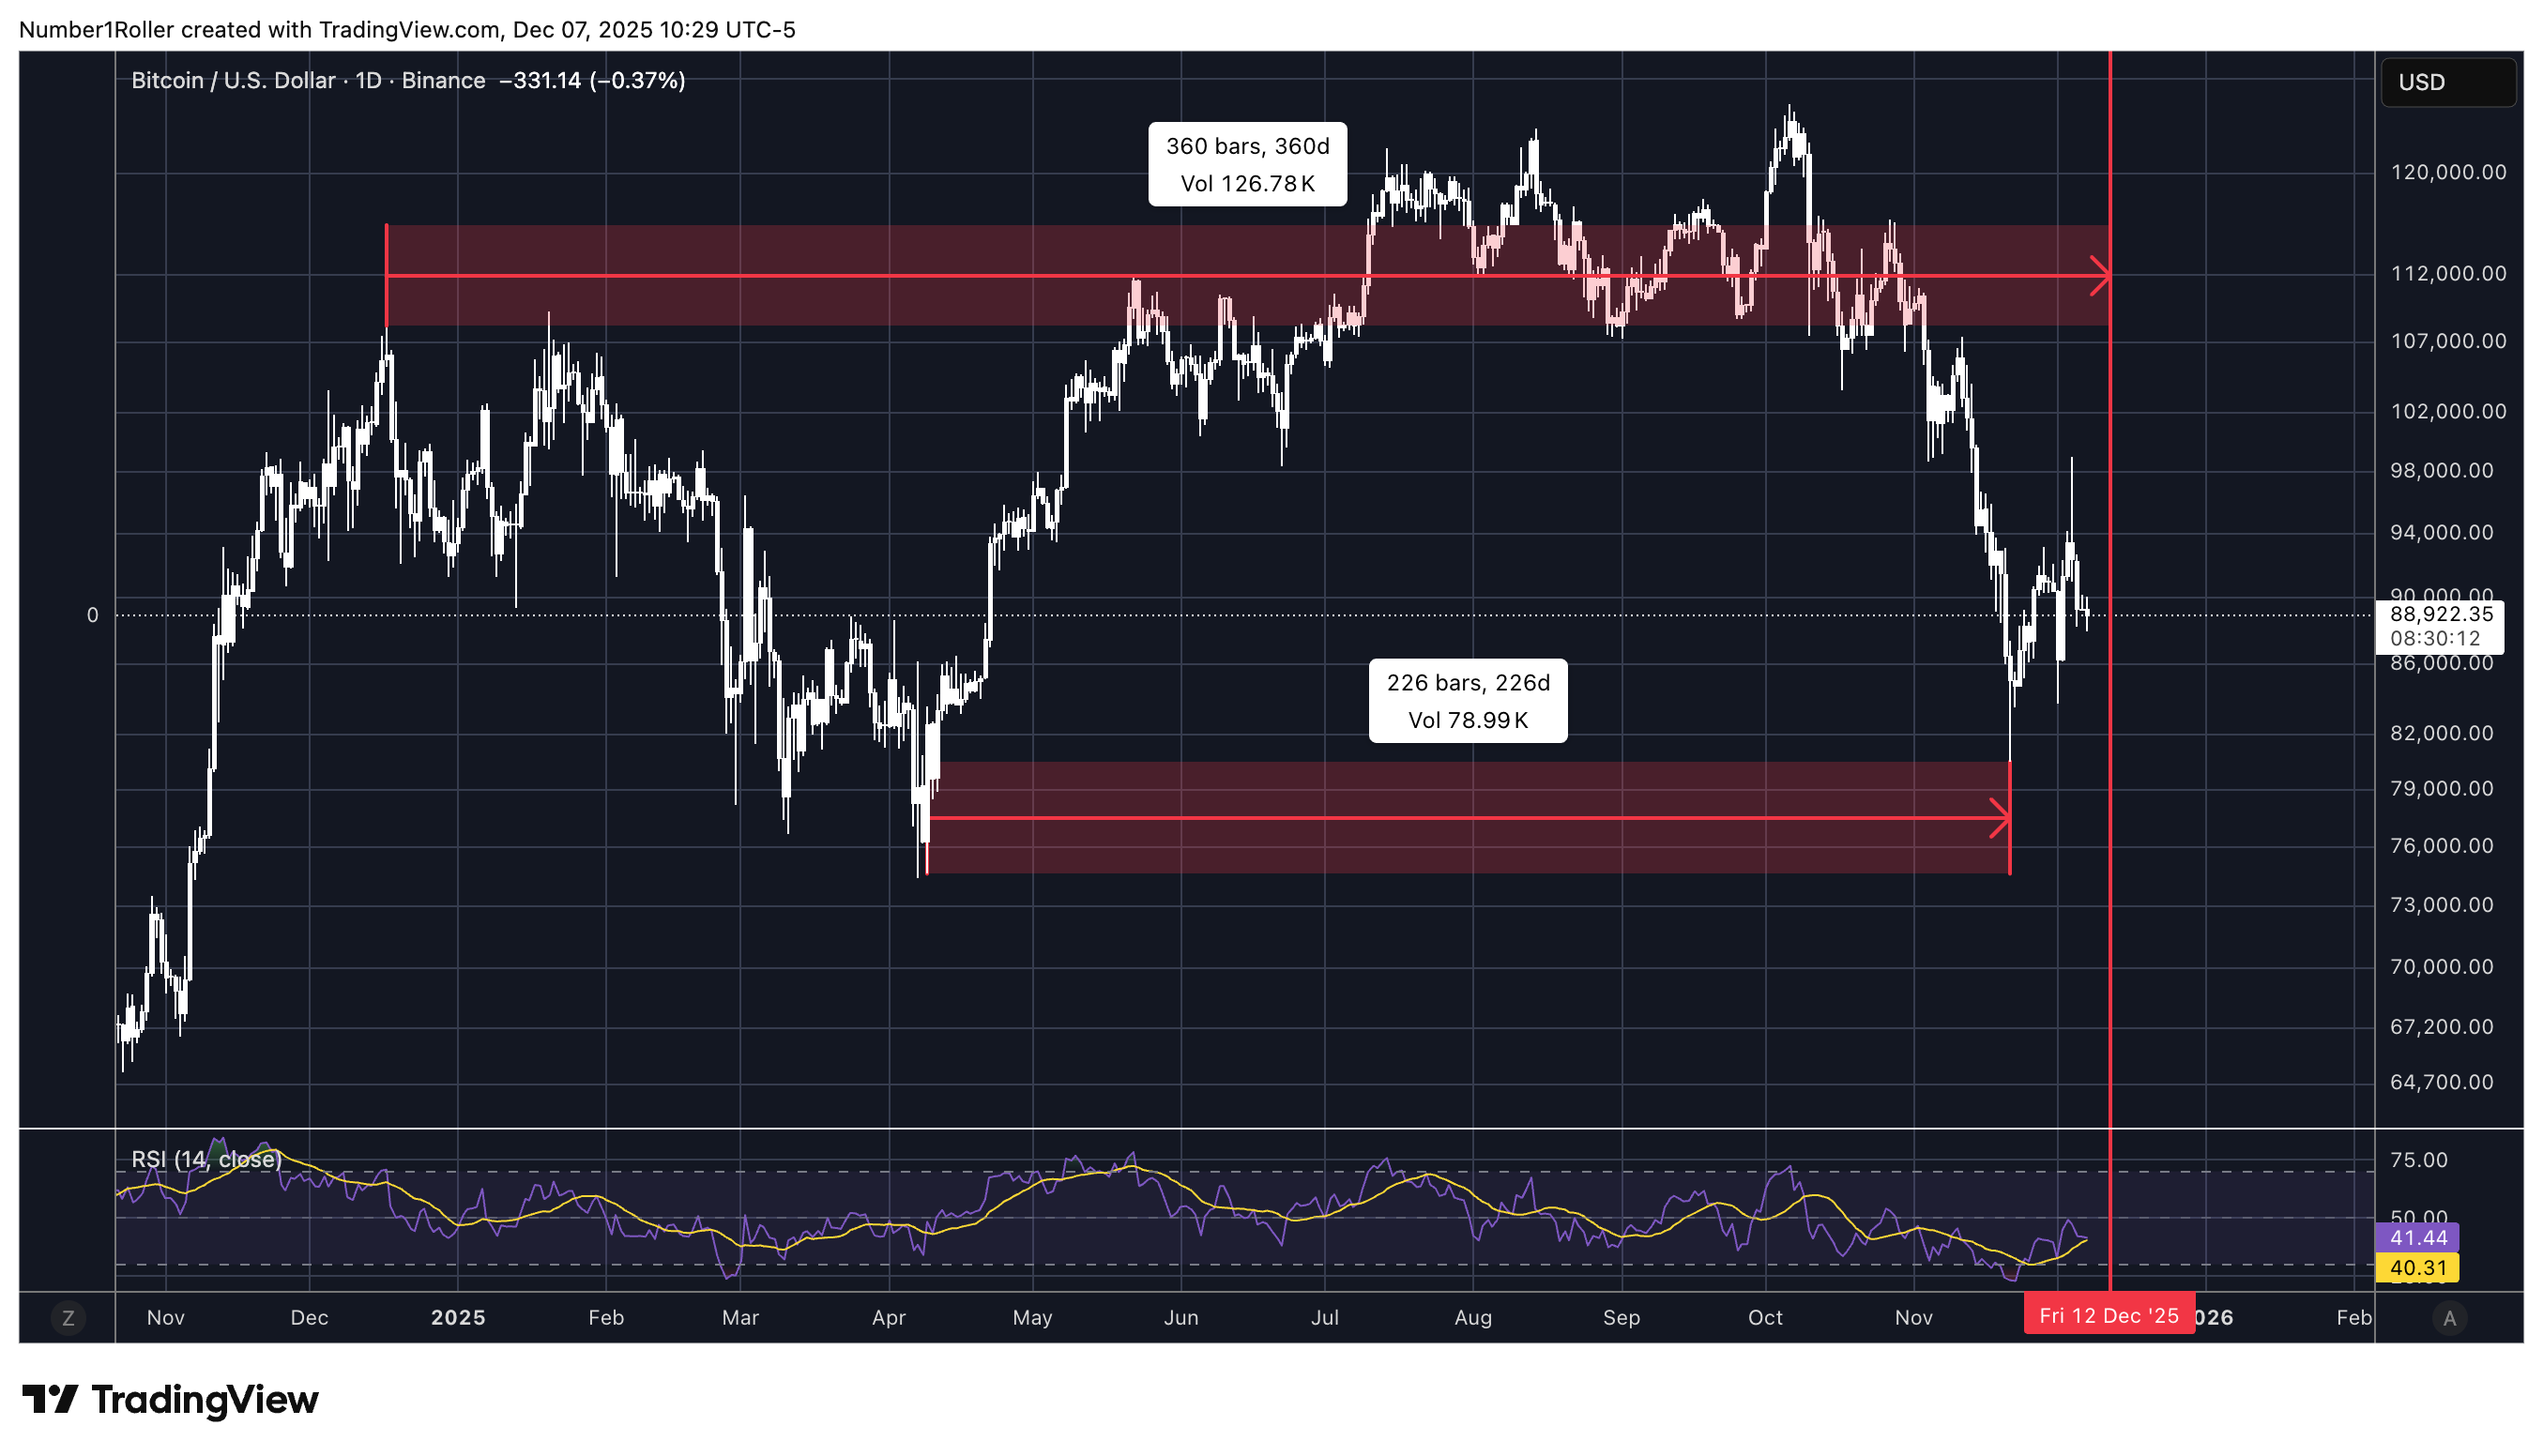
That also shows us the low that came in 225 degrees from the April low and marks a seasonal swing time according to Gann.
When you split the year into 8ths as Gann did you come up with 8 sections of 45 degrees in the year.
So not only do we get the time of 225 days to watch for a trend change but that date came 45 days off the October top.
Lastly, I want to take another look at the 15 year cycle as I see it being of major importance going into 2026.
In that cycle we got the low 15 years ago on the week of December 6th.
Recently, we saw an inversion of this major cycle but if we are to be getting back on track a low around this time frame would make sense.
Together we have a key anniversary date from last years December top, coinciding with the yearly seasonal pattern, and showing a potential reversal in line with the 180 month cycle.
Squaring Time and Price
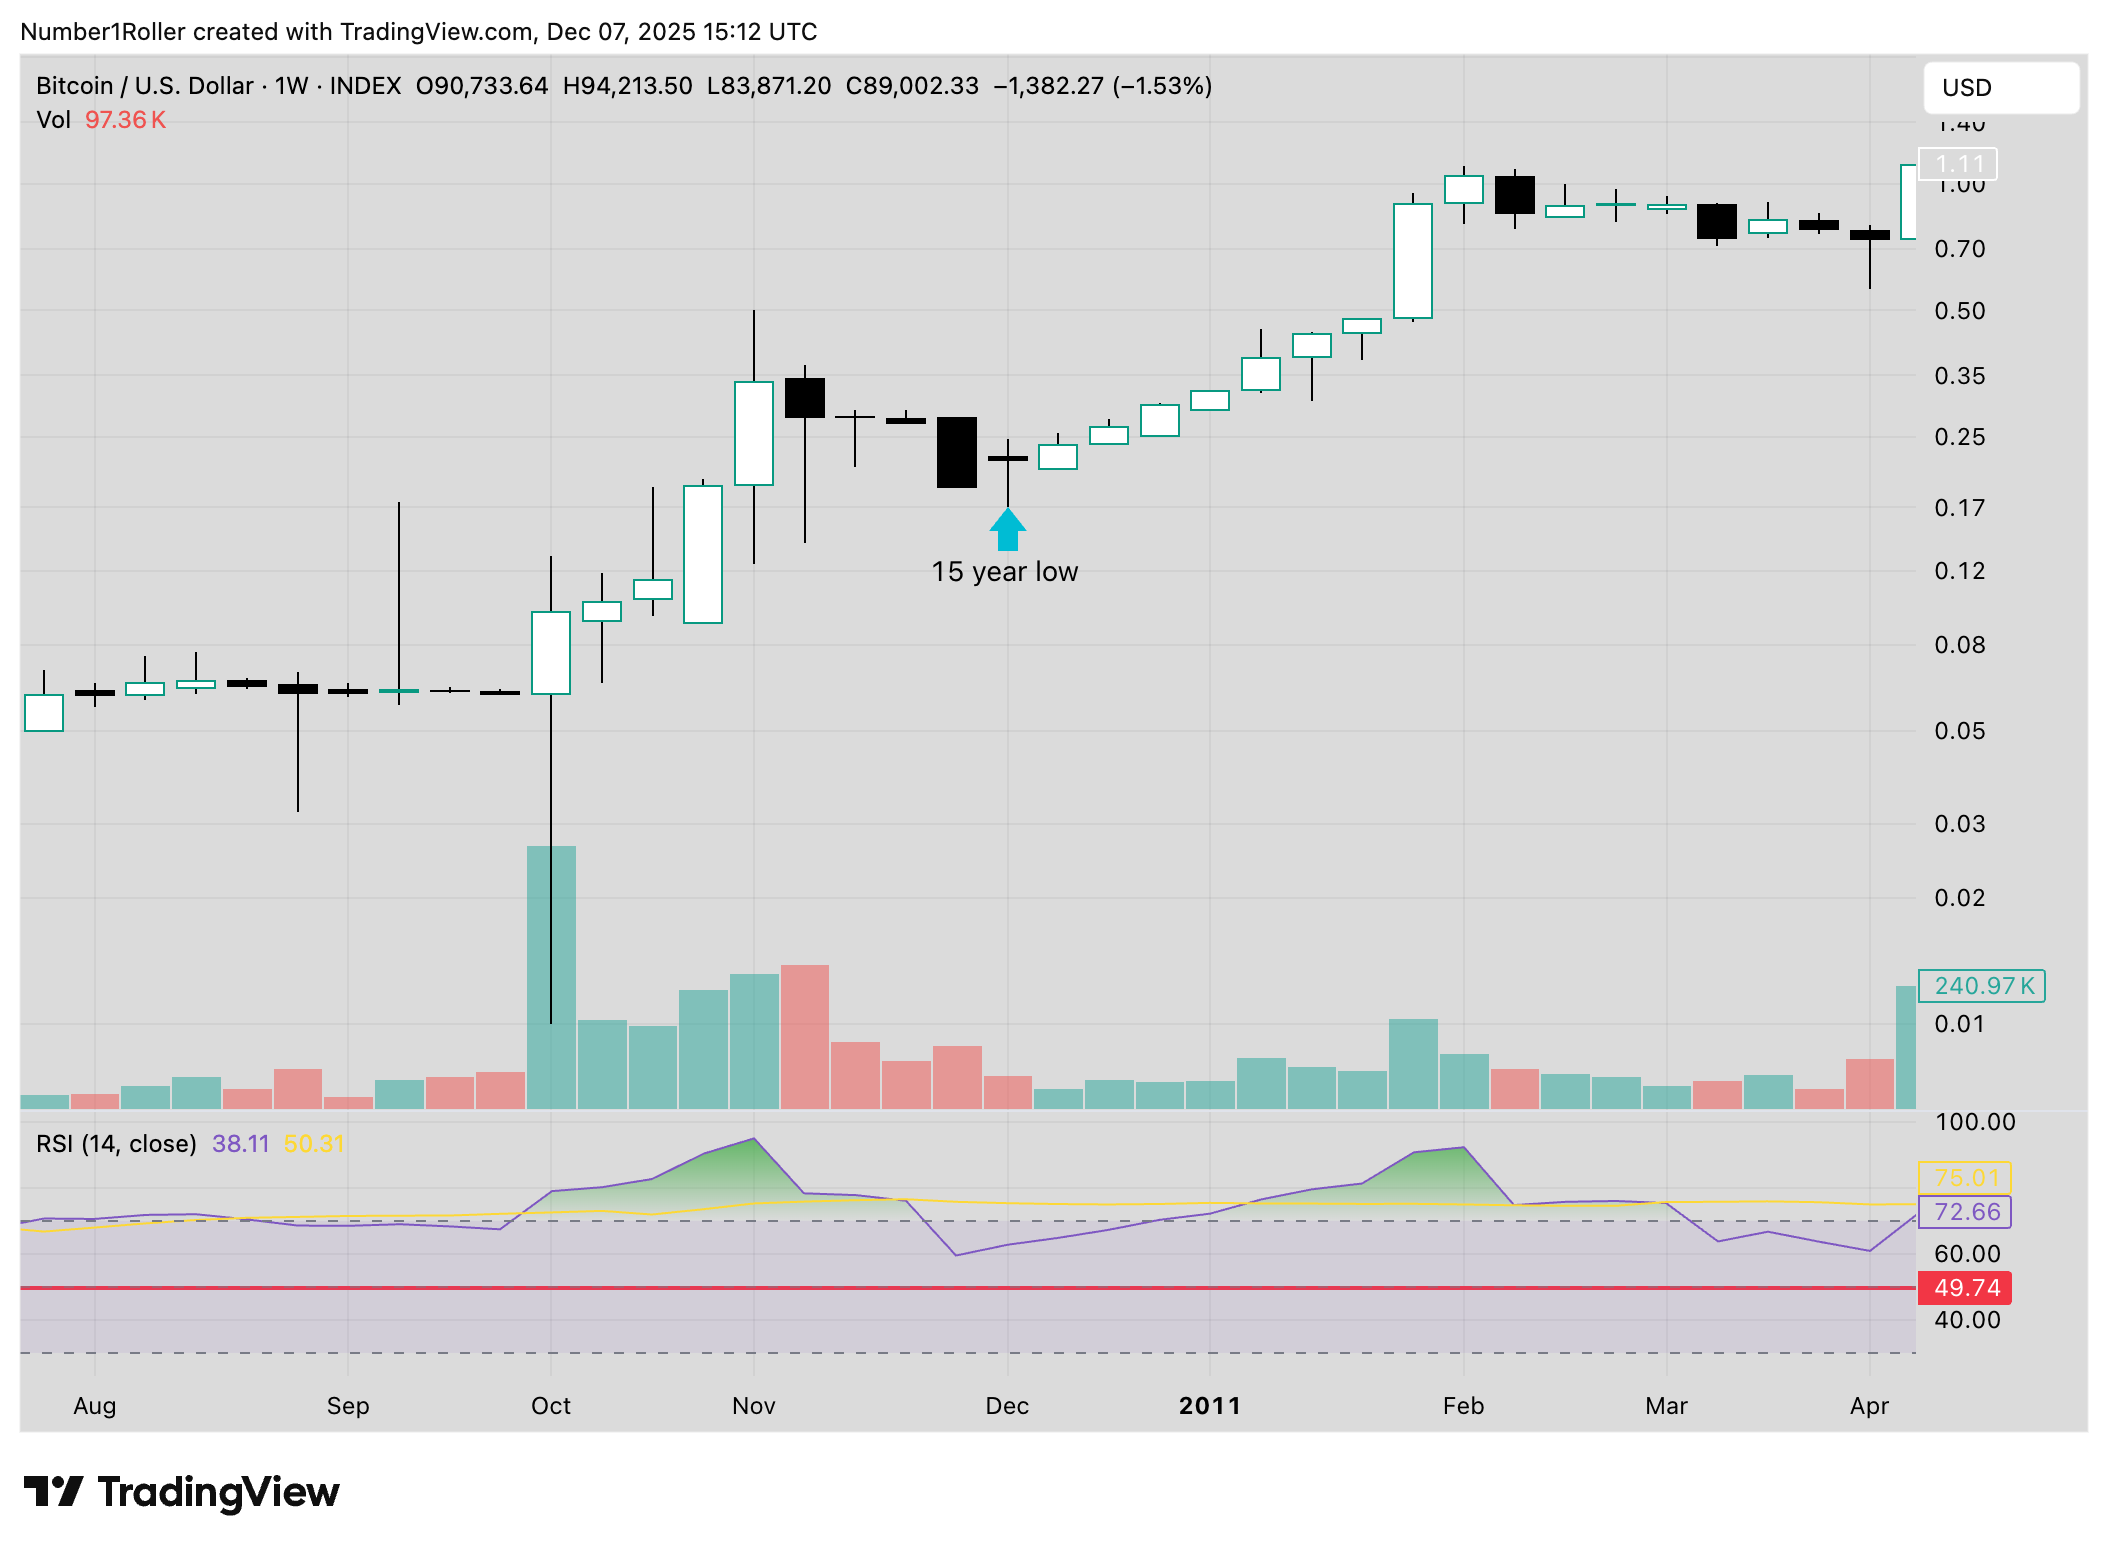
Measuring time frames, time by degrees, and seasonal times will get you 90% of the way there when trying to work out major pivots but the real nail in the coffin on this analysis is when time and price squares out with it all.
We know price and time squared out on the decline with a 46k move down in 46 days so we have a strong reversal point on the daily 1/1 angle.
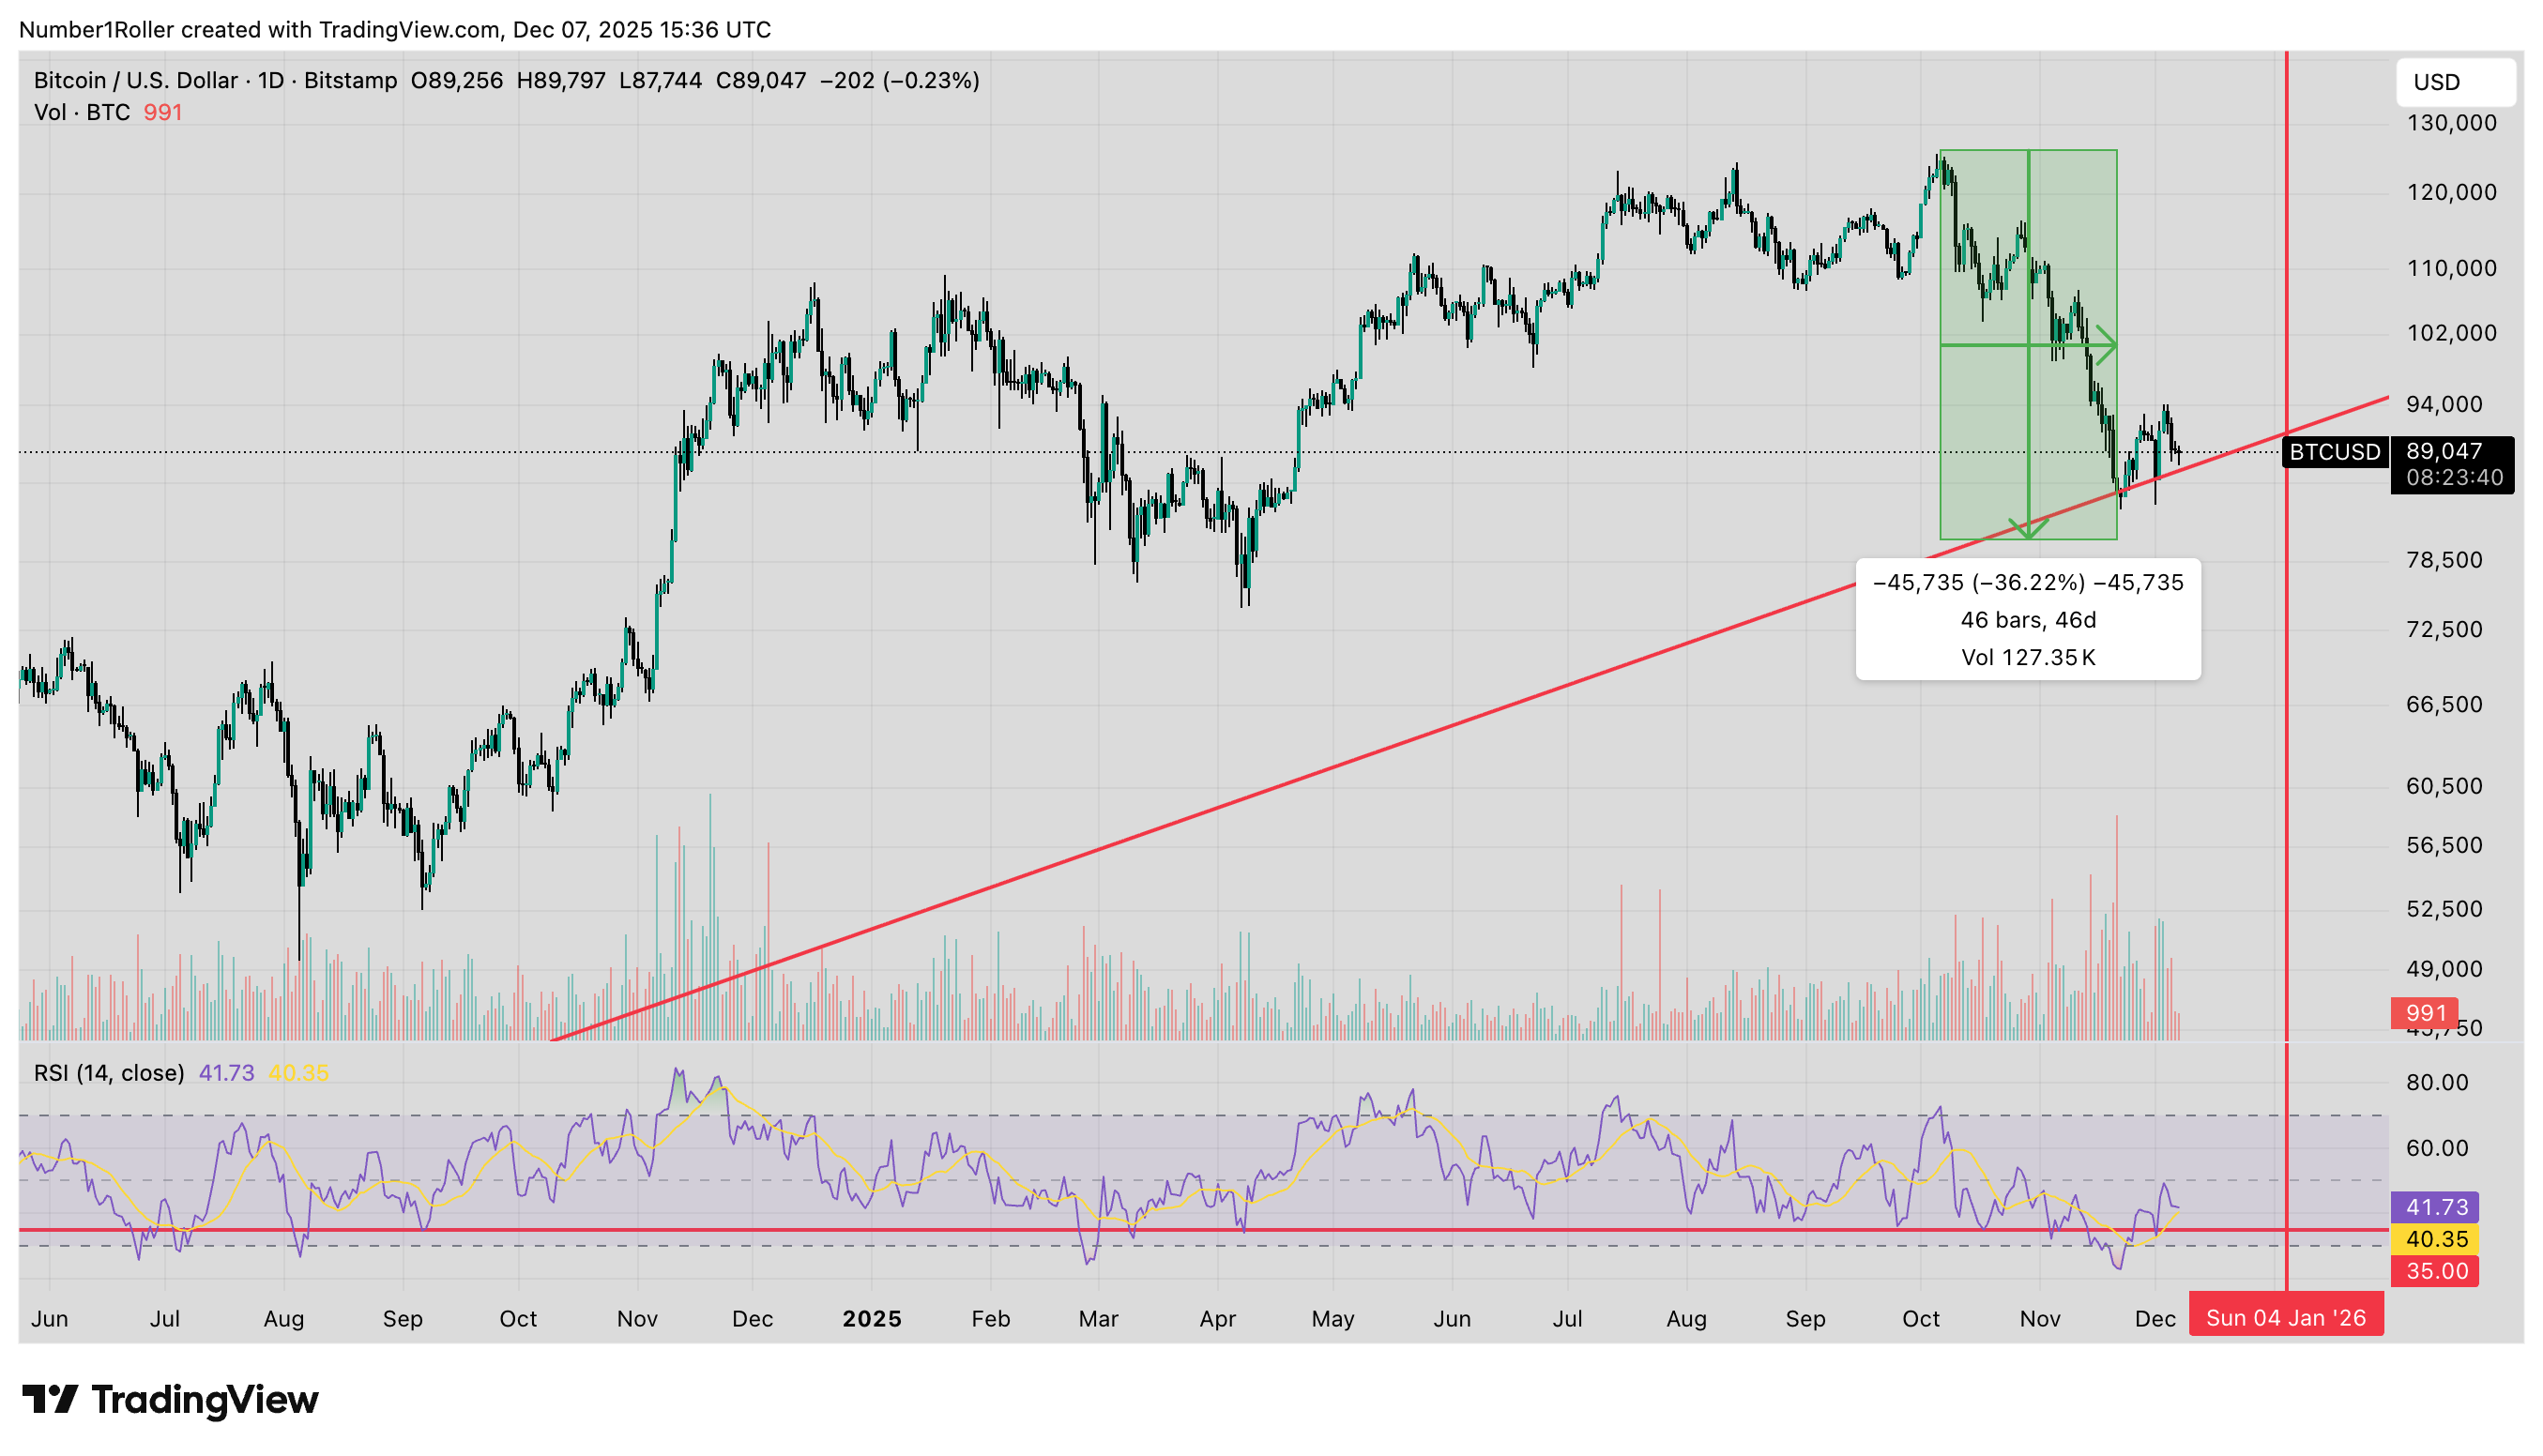
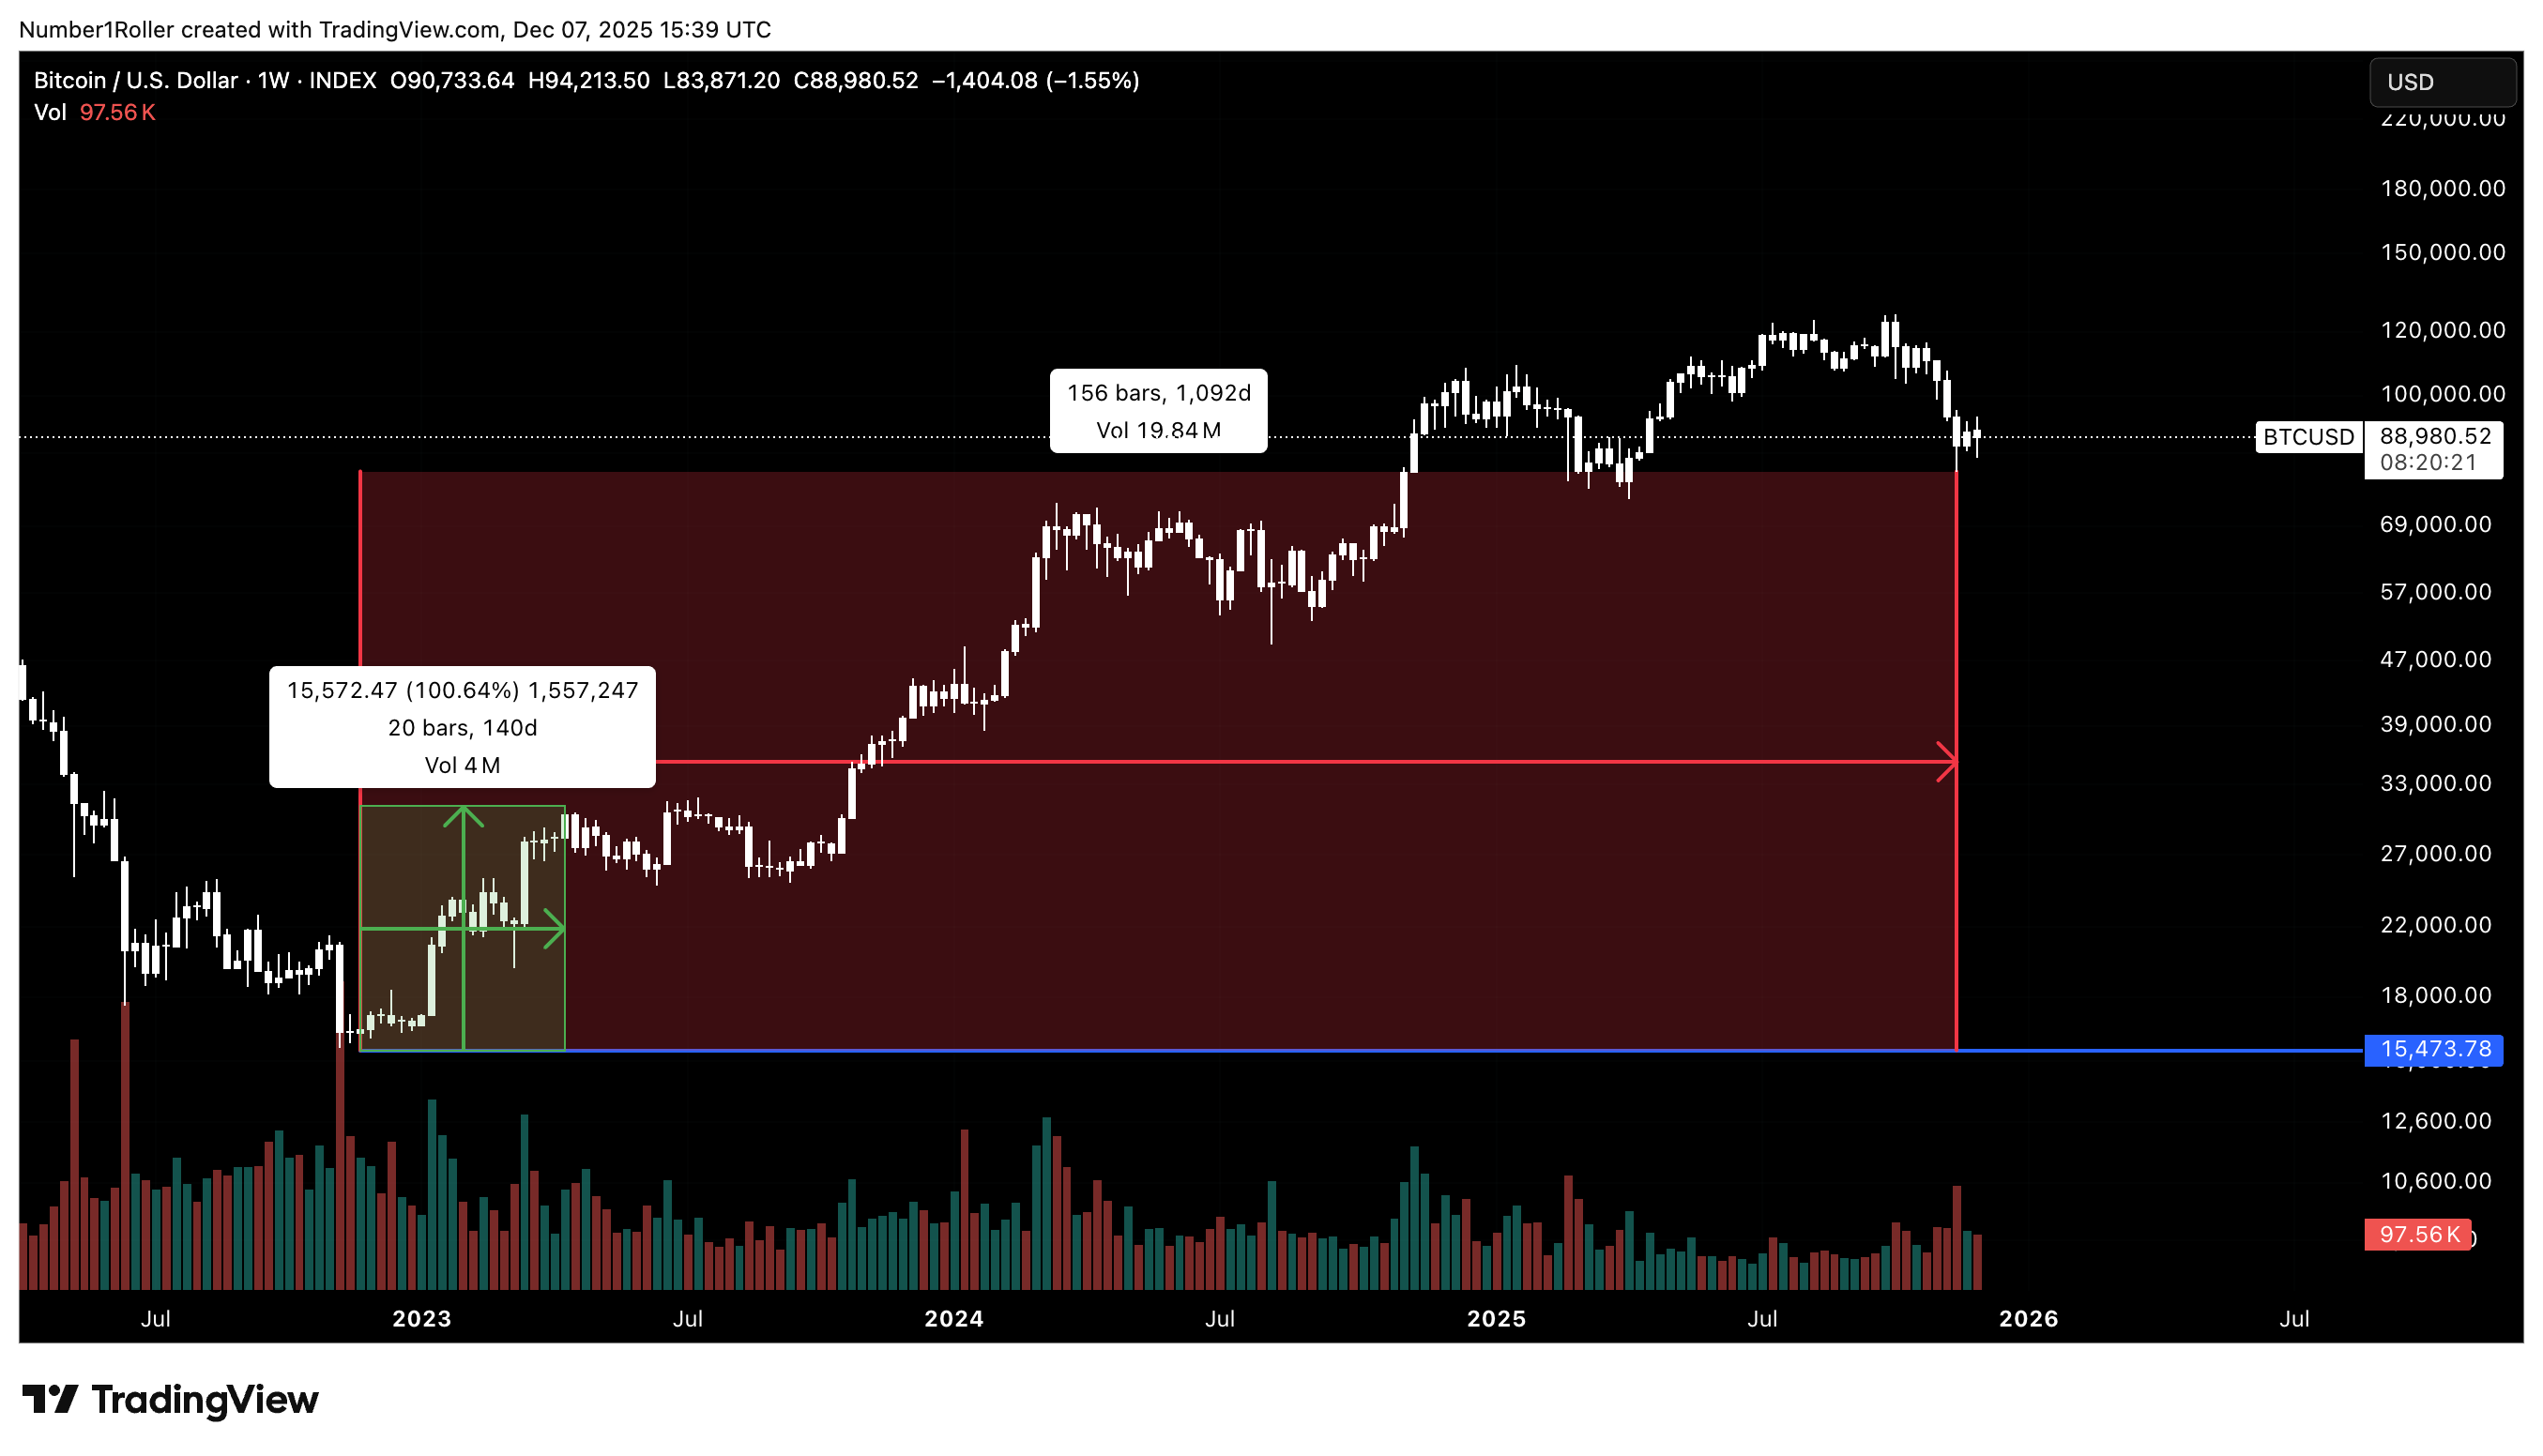
We can further the strength of that squaring by looking back to the August 2024 low below. That low occurred at a price of 49,577. If we look forward from that low 495 days you get December 13 which is just one day out from the top of last year and the seasonal time. *note the midpoint of this square came exactly at the April bottom.
Next looking at some higher time frame squares if we take the low of the cycle at 15,480 we can go forward 1,548 days and up 154,800 points and you get the below line that squares time and price from the cycle low.
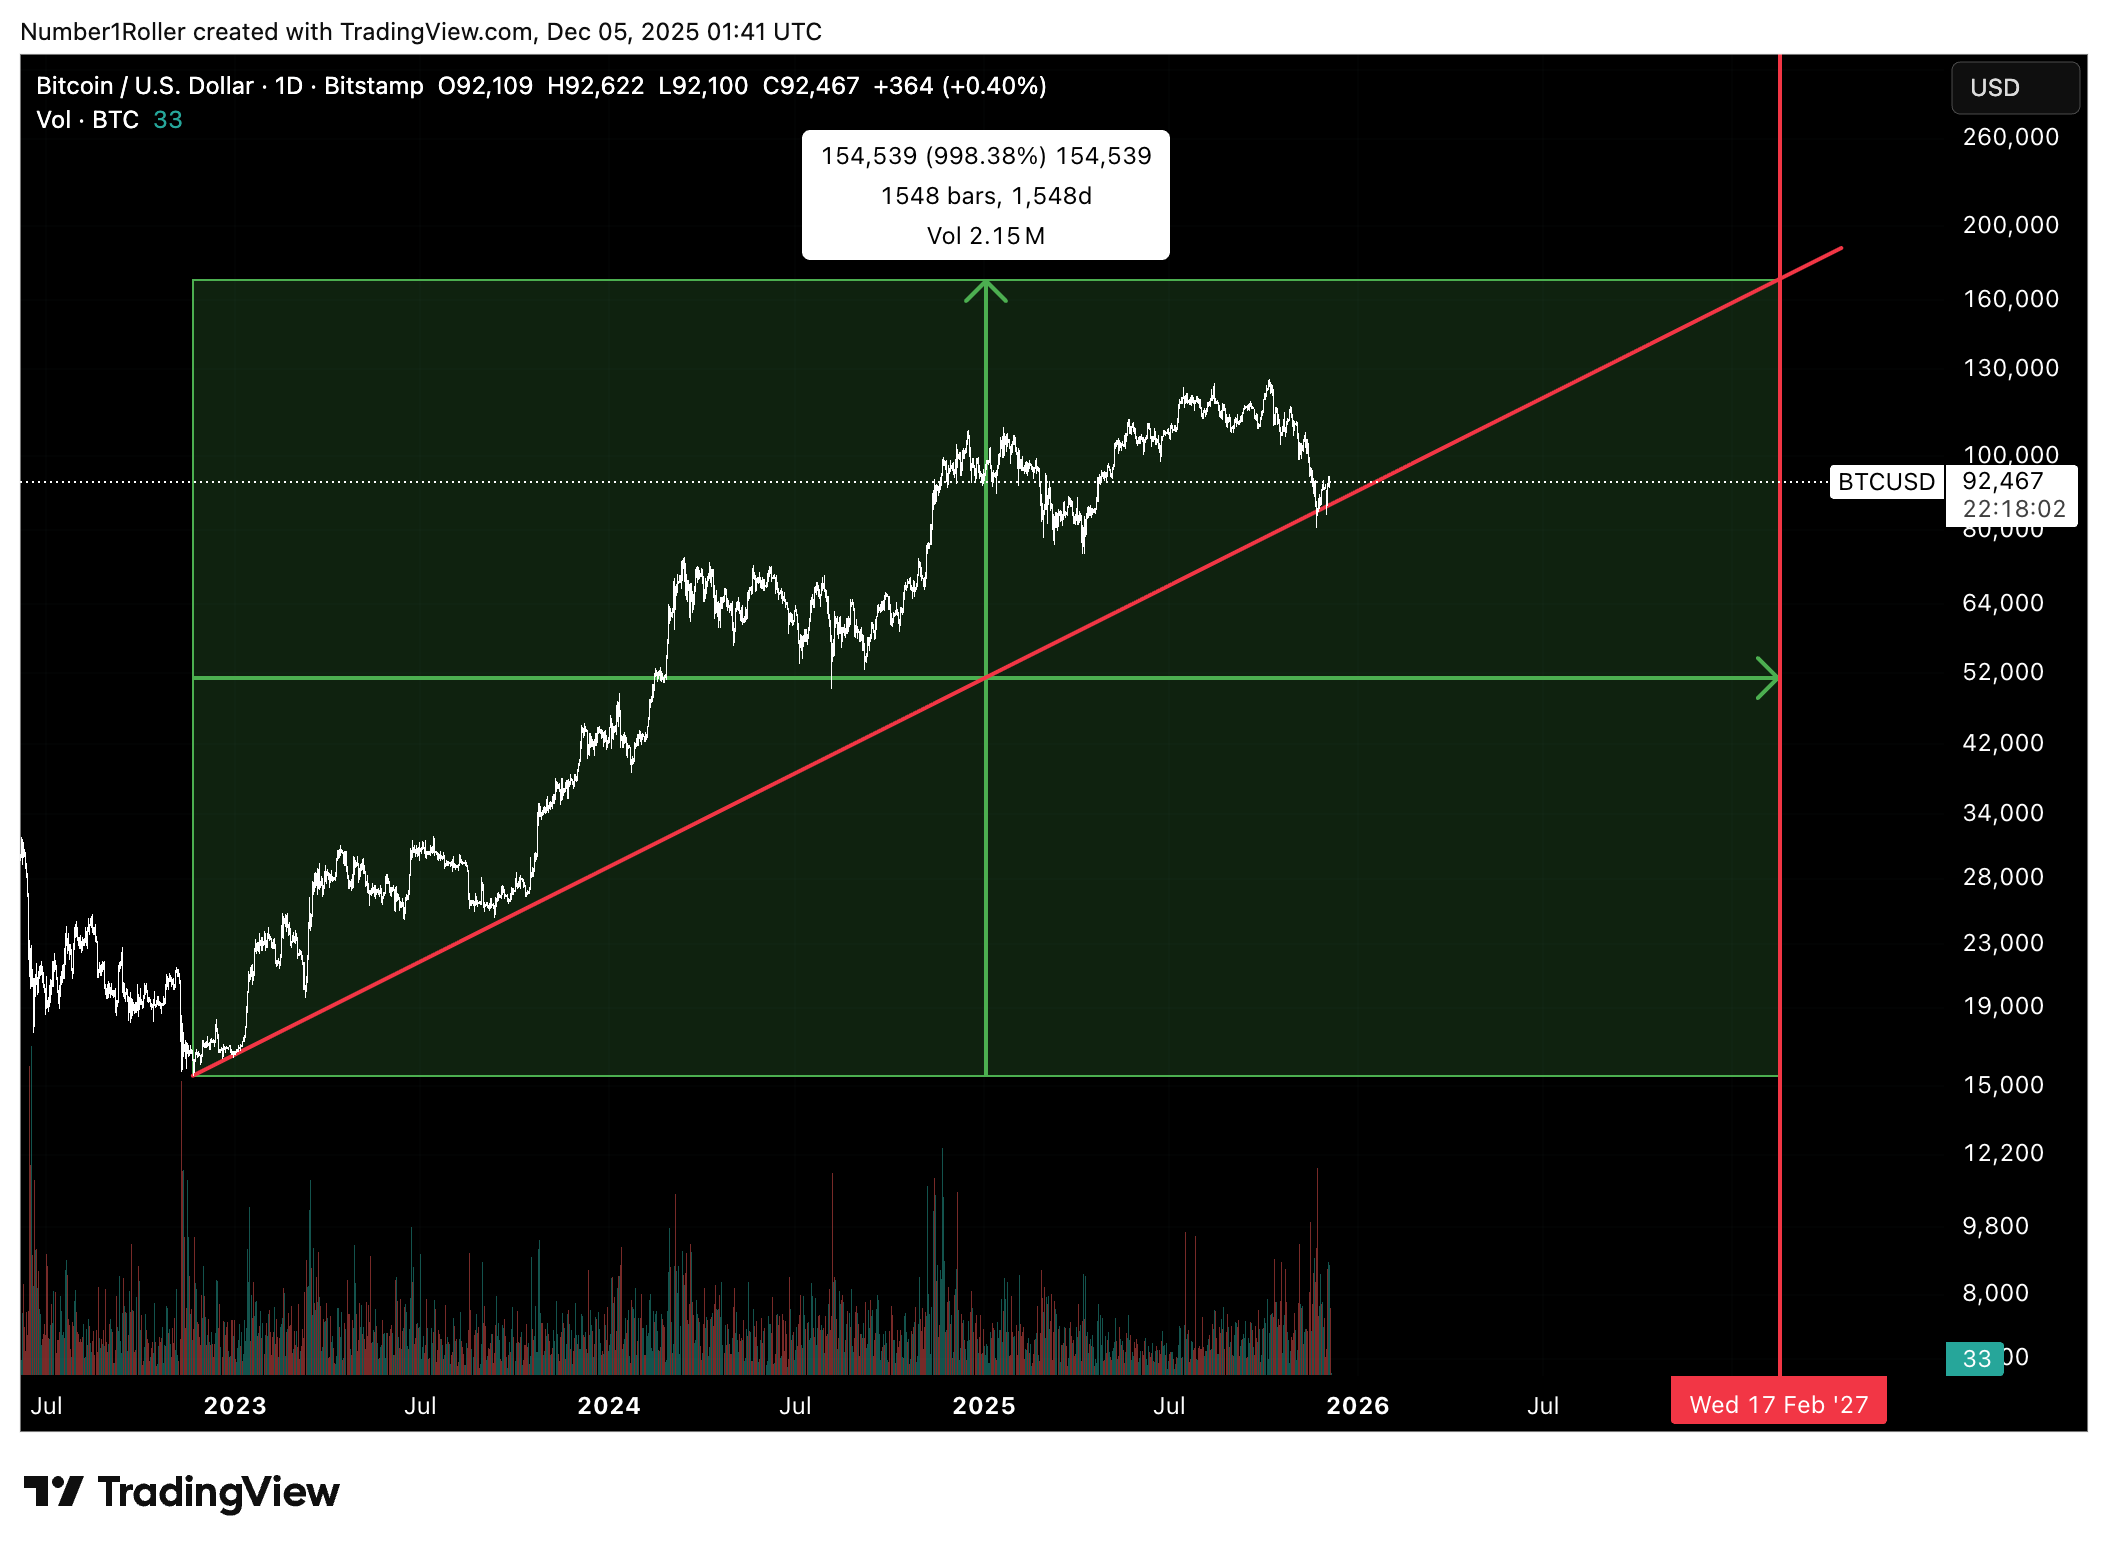
Additionally, I want you to pay attention to just how important the cycle low is.
Notice how the price of 15,480 turned into that first range up from the bottom which was 15,500 points.
You will continually notice how price turns into time and vice versa. So looking forward 155 days, 155 weeks and 1,550 days will all be important. Its interesting to note that this most recent low came in at 156 weeks or just one week out in 3 years which was also the anniversary of the cycle low on November 22nd.
Conclusion
This isn’t a theory. It isn’t wishful thinking.
What I just laid out is the exact same confluence of Gann time cycles, price squares, anniversary dates, seasonal turns, and unbreakable market structure that has nailed every single major low this cycle without exception.
The market just did what it always does at real bottoms, it went maximally bearish, convinced almost everyone the party was over, and shook out every weak hand it could find.
The structure is still perfectly intact.
Key Gann price levels have held to the tick.
Time cycles have converged from 7 days all the way to 15 years.
Time/price squares have called the exact day and dollar.
This isn’t coincidence.
This is the market ringing the bell at the absolute low. Anyone still calling for a multi-month bear trap is about to get run over.
The four-year cycle crowd, the “higher highs/higher lows are broken” crowd, the perpetual perma-bears, they’re all standing on the wrong side of the market again.
We’ve seen this movie before. We know how it ends. The evidence is overwhelming and it’s sitting right in front of us this is the final major low.