
Bitcoin’s New Super Trend Plus Key Dates For A Q4 Top
We’ve entered the Bitcoin super trend. Today, I want to share some insights into the timing of the cycle and why the risk on environment is only getting started.
In addition, I’ll talk about seasonal dates and how we can expect the next few weeks to unfold given the major US holiday and our time factors coming into play.
Finally, I reveal when and why a Q4 high is likely coming in our next time window and the exact date that will be.
Bitcoin Monthly Trend and Other Risk Signals
As I highlighted last week, in my macro report, many people believe this cycle must end sooner due to the early all time high in price expansion. However, we have no evidence price wise or time wise that this should be the case.

In each of the previous three cycles bitcoin has entered a new price discovery phase at this exact time. Like clockwork, 23 months from the bottom BTC begins what is historically, the steepest leg of the bull market.
More importantly, not one occasion over the last 15 years did the cycle fall short of 11 to 12 months in expansion after this breakout.
Of course, there were nasty dips and this time will be no different. The 2021 cycle pulled out all the stops to fool the majority, but even then BTC still made the complete 11 month move to finish the cycle.
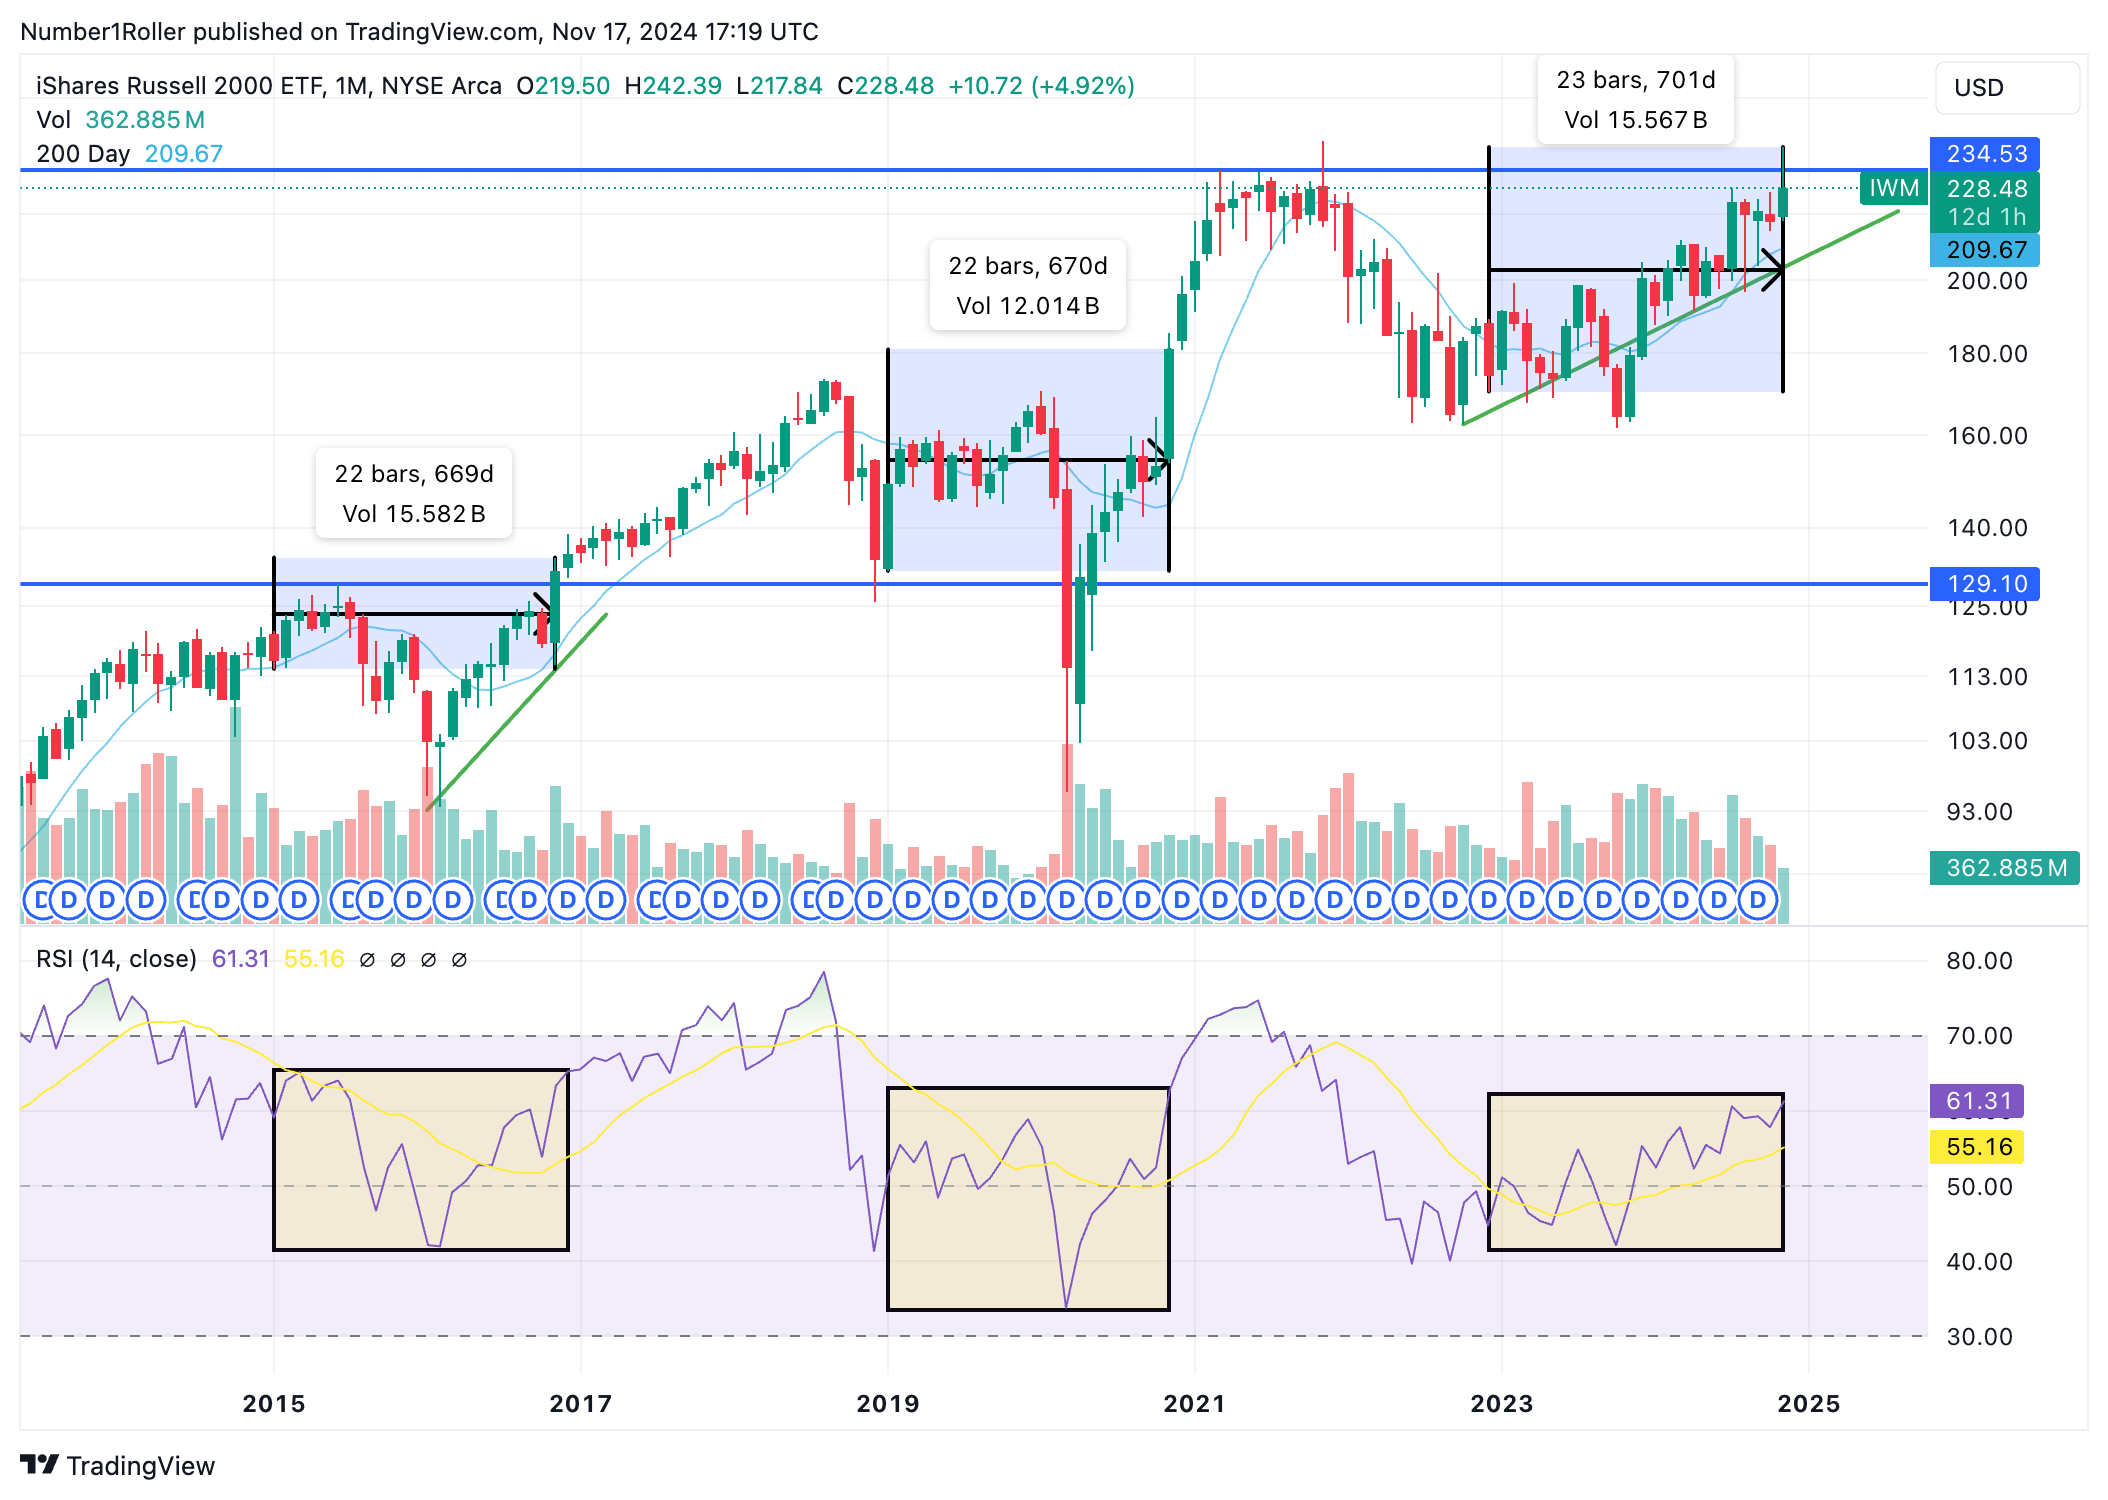
On top of that I noticed that IWM (Russell 2000 ETF) is following a near identical time pattern to BTC. I measured these time ranges starting from when BTC made its bear market bottom to its bull breakouts.
In the previous 3 cycles IWM has broken out at the exact same time, which is what we are seeing today.
Small cap equities signal a higher appetite for risk on Wall Street and amongst retail traders looking for bigger multiples.
Easing credit conditions and more activity in M&A serve as a tailwind for this sector and that’s exactly what we’re seeing at this stage.
BTC WEEKLY RSI
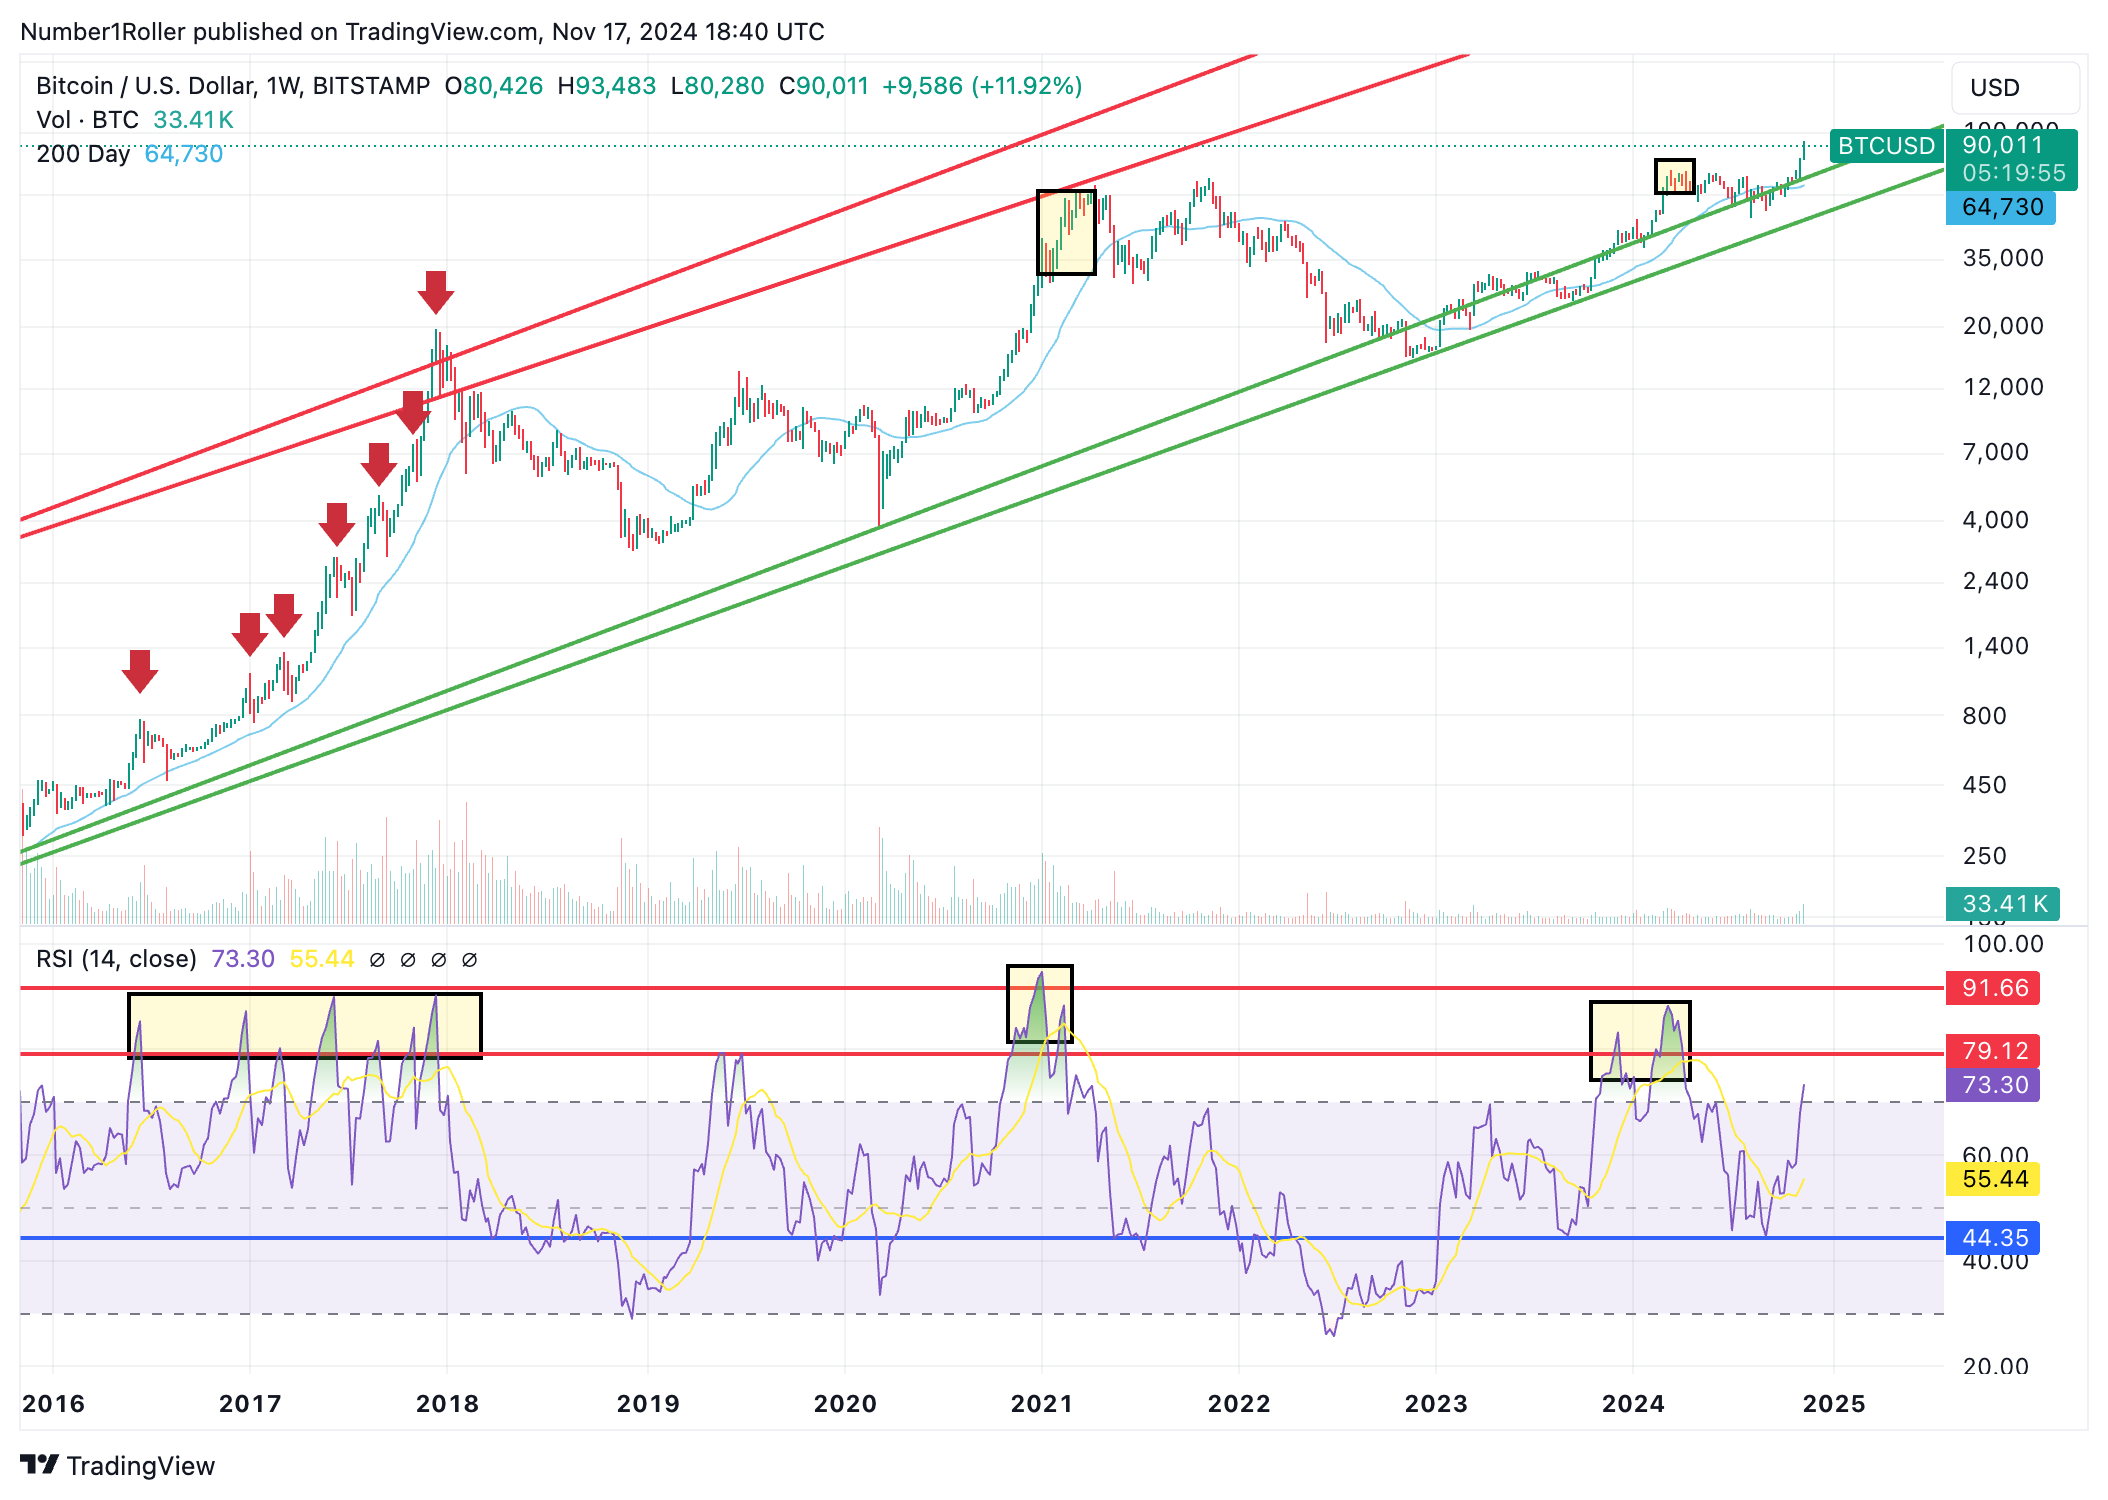
The recent move surprised a lot of people and therefore they believe that this market needs to cool off before going higher. However, we still see no signs of exhaustion on the weekly time frame.
The RSI is simply not overbought enough for a substantial 2-3 week pull back. In this phase of the cycle that would be the maximum extent of any pull back. The RSI typically gets into the low 80’s at a minimum before a weekly correction occurs and we aren’t there yet.
Again, zoom out watch the weekly and monthly trends, all else is just noise.
BTC Seasonal Dates
With this week being a major US holiday the Gann holiday rule is in effect. The rule simply states to watch for changes in trend around holidays.
However, as you can see I expect this to be a non event. This trend and cyclical pattern are just too powerful to worry about a low time frame. The worst I expect is that this will be a slow, low volume week.
Everyone will go home and shill their favorite meme coins to friends and family and the market will take a pause then continue higher into early December.


December 4th is the Q4 High?
December 4th is my date of interest for now where we could see a local top or quarterly top and then a two week correction or consolidation.
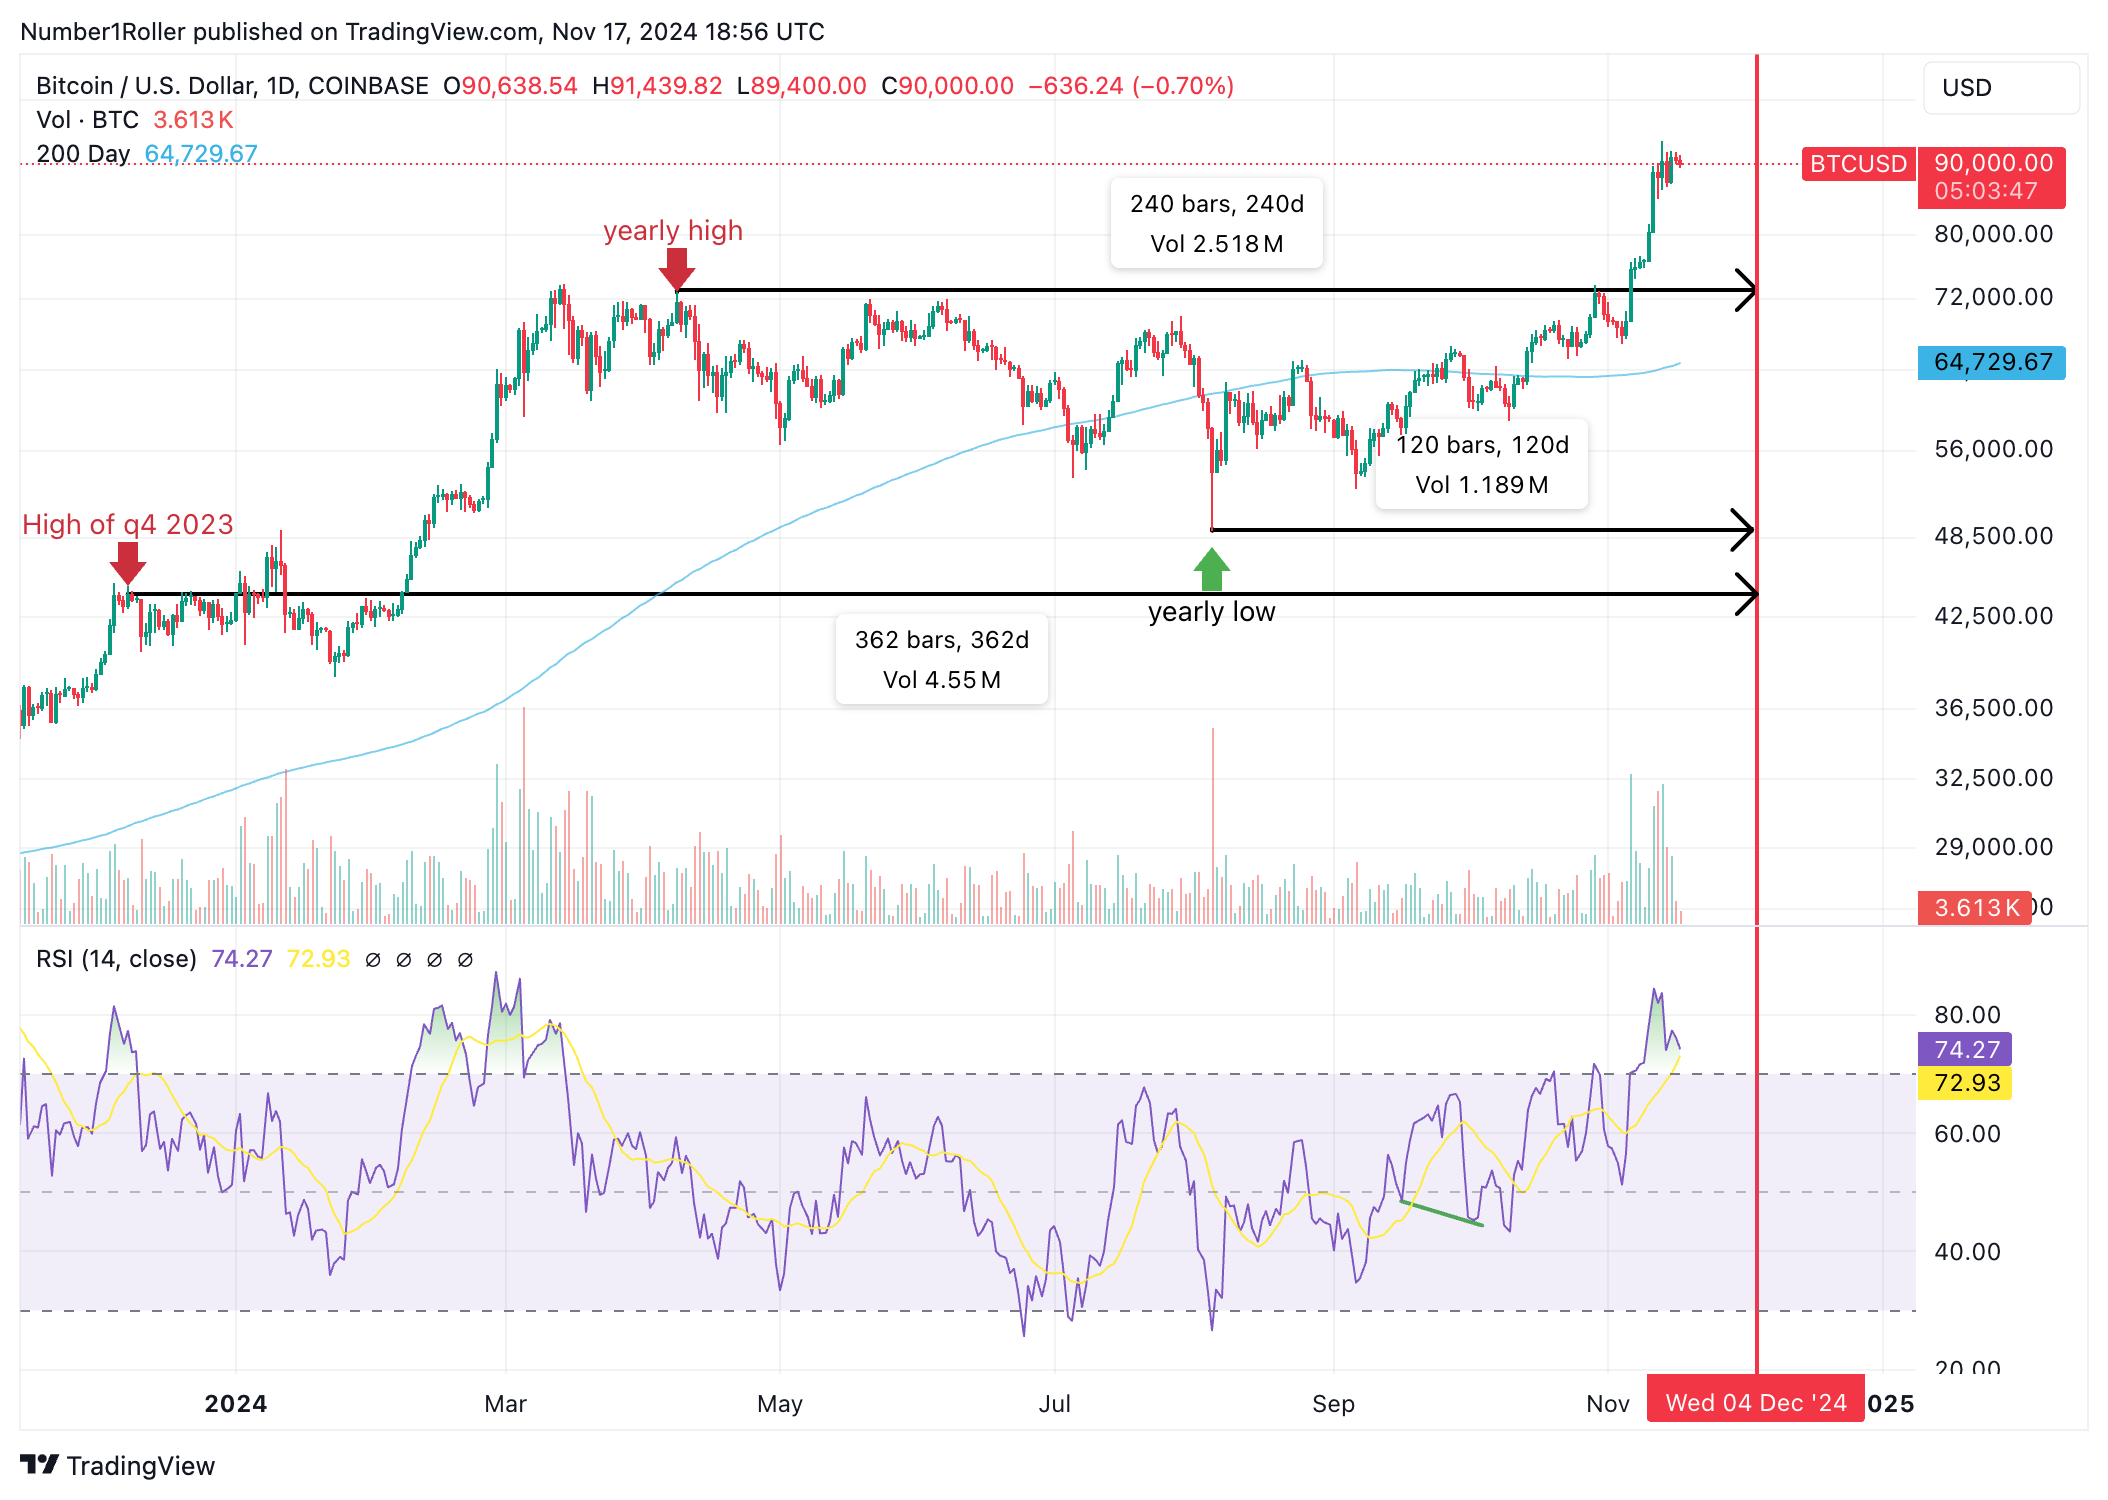
If you look at the chart we are working off of 120 degrees from the August low and 240 degrees from the April top.
120 x 3 = 360 degrees
Meaning, this market is working in a triangle within the circle. Every 120 days brings in the major high or low of the quarter. We predicted the October window would be the low of Q4 now I am telling you to watch December 4th for the Q4 high.
Notice how we made the Q4 high in 2023 on December 8th, just over 360 degrees ago. That said, it wasn’t a major bottom falling out of the market but it certainly did mark the high of the quarter and BTC struggled until January 2nd before regaining new highs.
Conclusion
There is no reason to believe this time is different. In fact, it’s what I keep saying will fool the most amount of people.
If anything, the only way this cycle is different is that its bigger than 2021 by orders of magnitude.
We said it a year ago when BTC made a rapid all time high that the cycle was right on track.
How do we know this?
Because time is the strongest factor in the market. Price will fool everyone, time cannot.
Historically, a double from the recent November breakout would put us around 130k BTC by March and that is as conservative as it gets.
In 2021 it did a 5x and in 2017 it did a 20x in that same time window. Based on previous moves and the strength of this trend it’s more likely that 100k gets smashed through than it is to act as resistance.
I expect in the shorter term the market will extend over 100k in a huge fomo candle to 107/108k.
People will bid up small caps and memes over the holiday and push the market into an early December frenzy where a weekly consolidation period will begin and the high of the quarter will be marked.