Election Outlook and Key November Dates
Exploring how the four-year election cycle influences the crypto market and whether the upcoming election will truly impact its trajectory.
Market participants often place tremendous weight on the U.S. presidential election, and while its political importance is undeniable, will it really have a significant impact on the crypto market?
Today, we’ll explore the four-year election cycle’s influence on both the stock and crypto market and analyze how our key dates align to determine whether this election will truly move the needle—or if the market has already priced it in.
To start, let’s review some of W.D. Gann’s election year rules from his book Truth of the Stock Tape. Gann observed that markets tend to anticipate election outcomes long before they occur. Whether the result is perceived as good or bad, its effects are usually discounted ahead of time. Historically, presidential election years often experience a scare leading to a severe decline. But, Gann noted, after the election, a short-lived rally, or sell off, often takes place as the public reacts to the news. Yet, he cautioned, this initial burst of optimism or pessimism is typically fleeting. The smart move is to wait two or three days to see if the market continues in the same direction before taking action.
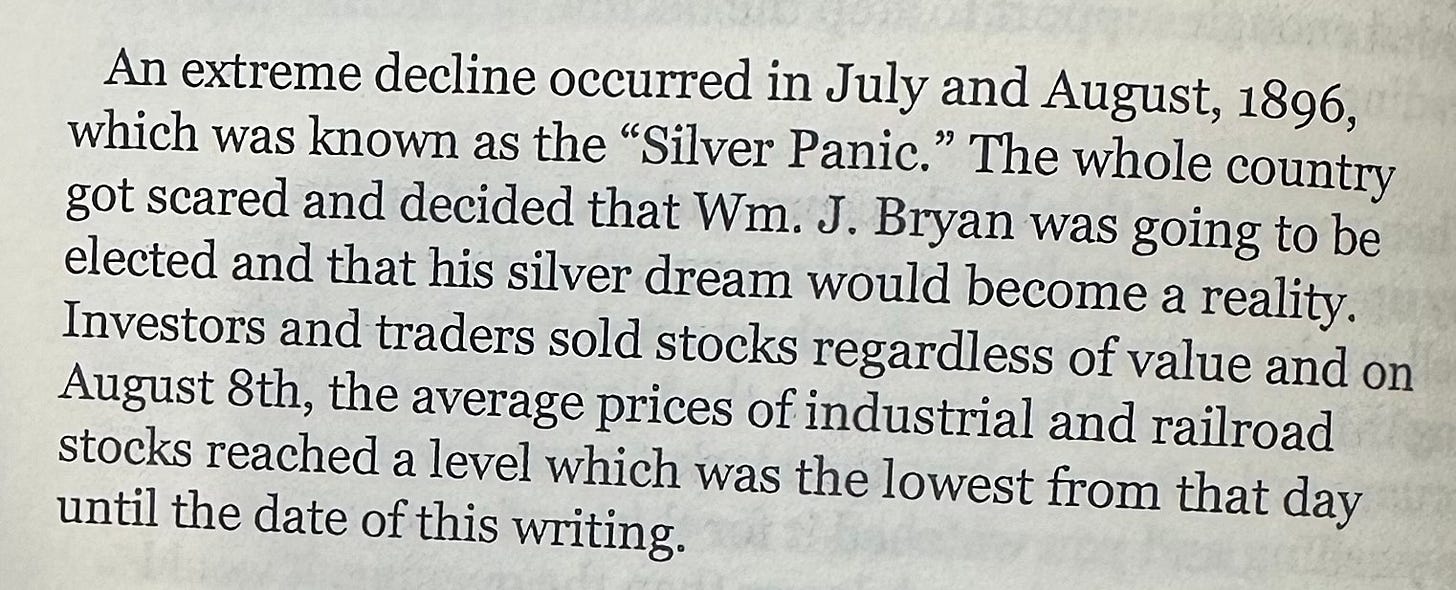
Now, I want to share a passage from the same book and an example Gann gave of a pre election panic.
Looking at recent events, we saw a similar pattern in August of this year with the market panic around the Yen—right when Kamala Harris was leading in the polls. These kinds of reactions remind us that markets often respond to perceived uncertainty. But does the election outcome really matter? Or has the market already discounted it?
Gann went on to write about another election where the surprise victory of Wilson in 1912 took the market by surprise. Stocks had rallied in September and October because the republicans were sure that the democrats would not win. Wilson (a democrat) won that election in a shock and the markets sold off for the next two years. Now, bear in mind that this would have happened regardless of who won.
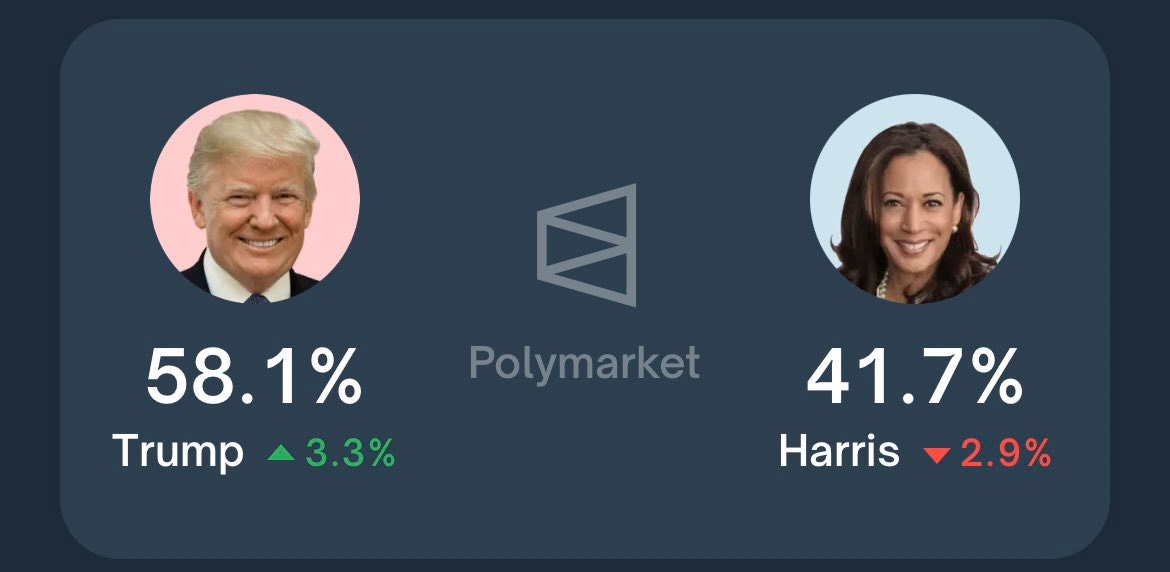
Again, looking at today’s standings, if we are talking about sheer polling numbers, prediction markets, and sentiment, it appears that Trump is firmly the favorite going into election day and any other outcome would be a surprise to the market.
So, with both of the scenarios Gann has illustrated in play, we have to turn to our cycles and time analysis to see what the most likely outcome will be and what impact, if any, it may have.
Readers already know our opinion that the election’s outcome is unlikely to be the defining factor for this market cycle. We already have key major drivers like rising global liquidity and central bank policies well in motion, regardless of who wins. Whether it’s tax cuts from one party, or increased government spending from the other, the market’s broader trajectory is shaped by forces much larger than a single election or single person.
Bitcoin During Past Election Cycles


Here, we have the weekly charts of BTC pointing to the weeks of US presidential elections in 2012, 2016, and 2020. It doesn’t take a genius, or any type of technical skill for that matter, to see that the market was virtually unaffected by this event.
However, the one notable aspect that these charts do show, is the consistent July/August discount that the market gave every single election year. So was the August panic really just a pricing in of the election just like all previous cycles? It seems to be rhyming and, it was in fact another critical piece as to why we were able to forecast that low. Remember markets are always forward looking.
November Seasonality
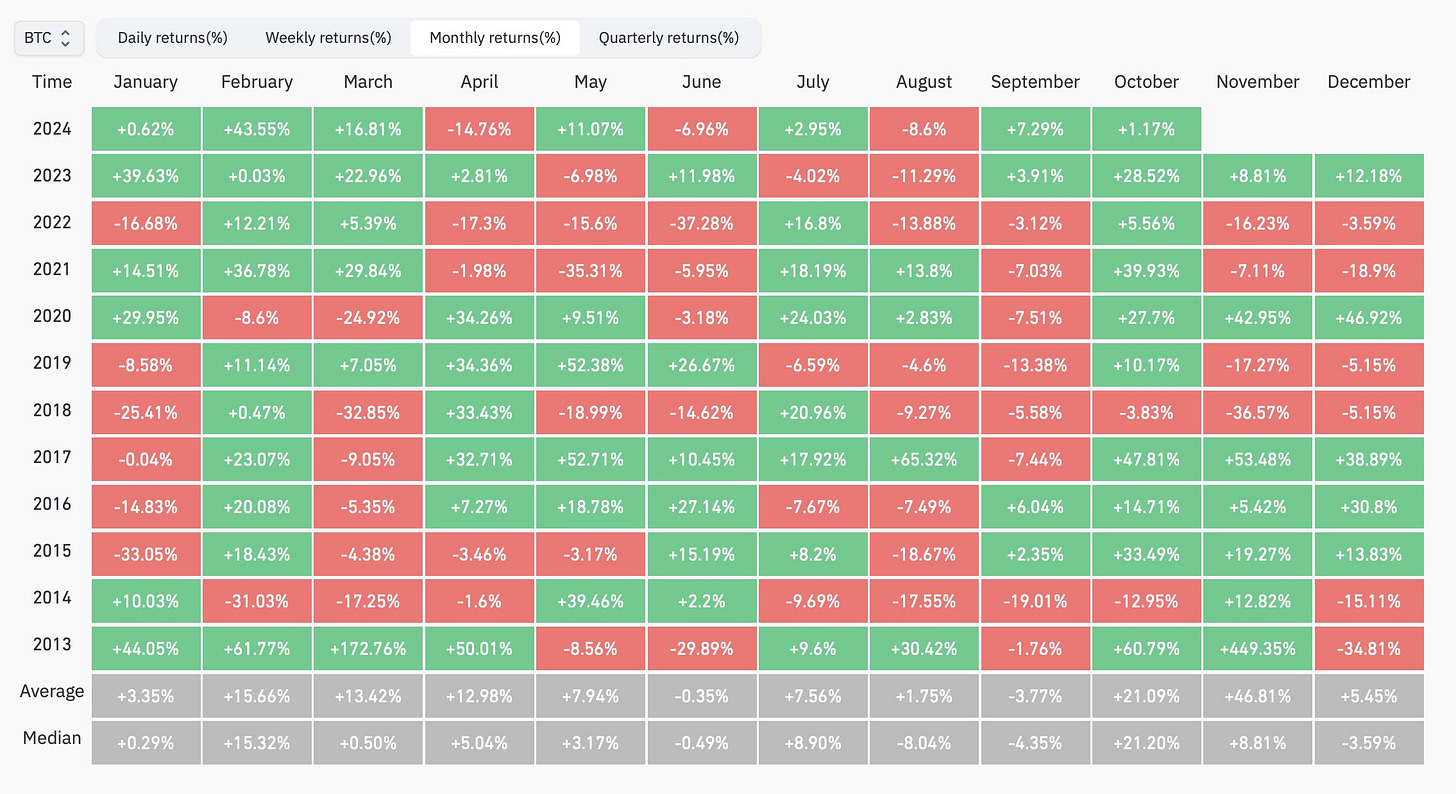
I’m sure you may have seen the chart above circulating on X by now. It shows us that in a bull market November has never been a down month and averages a return of nearly 47%. The one year of interest here is 2016 which showed only a slight 5.42% gain in BTC which was the year of Trumps first election victory.
Stock Market Election Cycles
60 Year and 20 year Election Cycles
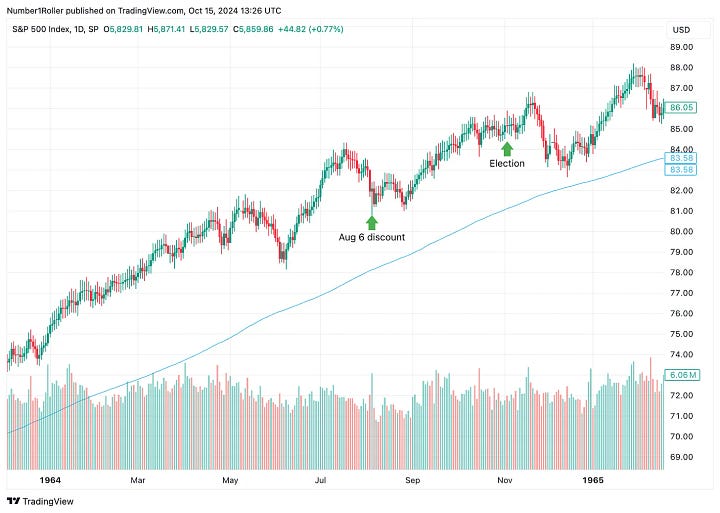

Above we have our two major cycles the 60 year and 20 year both which also happened to be US presidential election years. I find it very interesting that they both discounted the event on exactly the same day in early August and then the election was a non event.
Lastly, in 2004 notice how the SPY price action is very similar to what we had in BTC. March top followed by a long downward channel to an August 6th low and then a big year end rally. These are both very powerful cycles and likely our best maps for what may be in store year end. I will compare the other elections from the 2000’s below but these two are strikingly similar to what our market action has been this year.
It’s interesting that in 1964 the election was a landslide and the market actually went up into later November before ultimately having a big year end correction. This may be a scenario to keep in mind with Trump taking such a commanding lead in prediction markets suggesting a landslide victory.
2012, 2016 and 2020 Elections


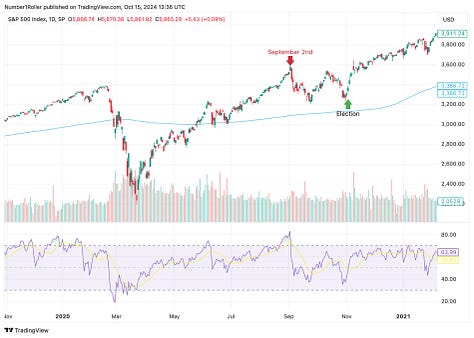
Here we have a look at the 2012, 2016 and 2020 election cycles. We skipped 2000 and 2008 because they were crash years and we don’t seem to be in that market regime.
Note how the 2012 and 2016 cycles carried a lot more uncertainty with them. In both cycles the market made its low in June not August and then made a run up to September before we saw a real stalling out in price action. This was a warning that the market had lost its momentum going into November.
It’s also interesting to see Gann’s rule in effect in 2012 and 2016 where the market ran down a few days after the election and then exploded higher. In 2012 Obama was elected for a second term and the public thought it was an unfavorable outcome, therefore selling after the result. In 2016 Trump won the election in what was really a shock to most people. The public again sold on this news only for the market to turn around very shortly thereafter.
2020 again gave us a similar setup where the market started to roll over in early September giving us a low around the election followed by a year end rally.
From these cycles we can conclude that every election of the 2000’s we have highlighted has resulted in slight volatility around the election before a bullish year end finish. The exception of course is the 60 year cycle which we have been following quite closely this year. In that scenario the market made a big move up post election and then a big correction into year end. Meaning, if we were to see low volatility around the election followed by a big move up then we would have to consider being quite cautious into late November and early December with stocks.

