
History is Repeating: A Powerful Year End Rally is Underway
Today I’m laying out why this setup is one of the rarest we’ve seen in years and why it’s likely to spark the biggest move in crypto in half a decade.
After nearly a year of going nowhere, the market is divided like never before.
In fact, if you track back to the day Trump was inaugurated, crypto is trading almost exactly flat eleven months later. In other words, this so called crypto administration has done nothing for prices. But all of that is about to change.
It’s unusual to see sentiment this polarized when we’re sitting just off all-time highs. The reason comes down to time. Most people are still caught up on the four year cycle when the macro cycle couldn’t be clearer.
We’ve got trade wars, real wars, inflation fears, recession talk, rate cuts and yet markets remain within striking distance of record highs. That’s the signature of a late-stage reset before a powerful next leg higher.
If you only focused on the headlines, sentiment, and price you’d assume this market is breaking down. But the timing says otherwise. The signals are aligning across every asset class from BTC, equities, gold, even memes and the confluence we’re seeing now hasn’t happened in over five years.
Today, I’ll break down exactly why that matters and what it’s signaling for what comes next.
BTC and the Wheel Within the Wheel
Starting with BTC and it’s current 90 day cycle.
We know the 90 day cycle is one of extreme emphasis in Gann because it divides the year into 4 equal parts giving us a full 360 degree cycle.
If we track back 90 days from the October 17th low you will see the market consistently turned out highs and lows every 90 degrees going back to the October 24th low of last year.
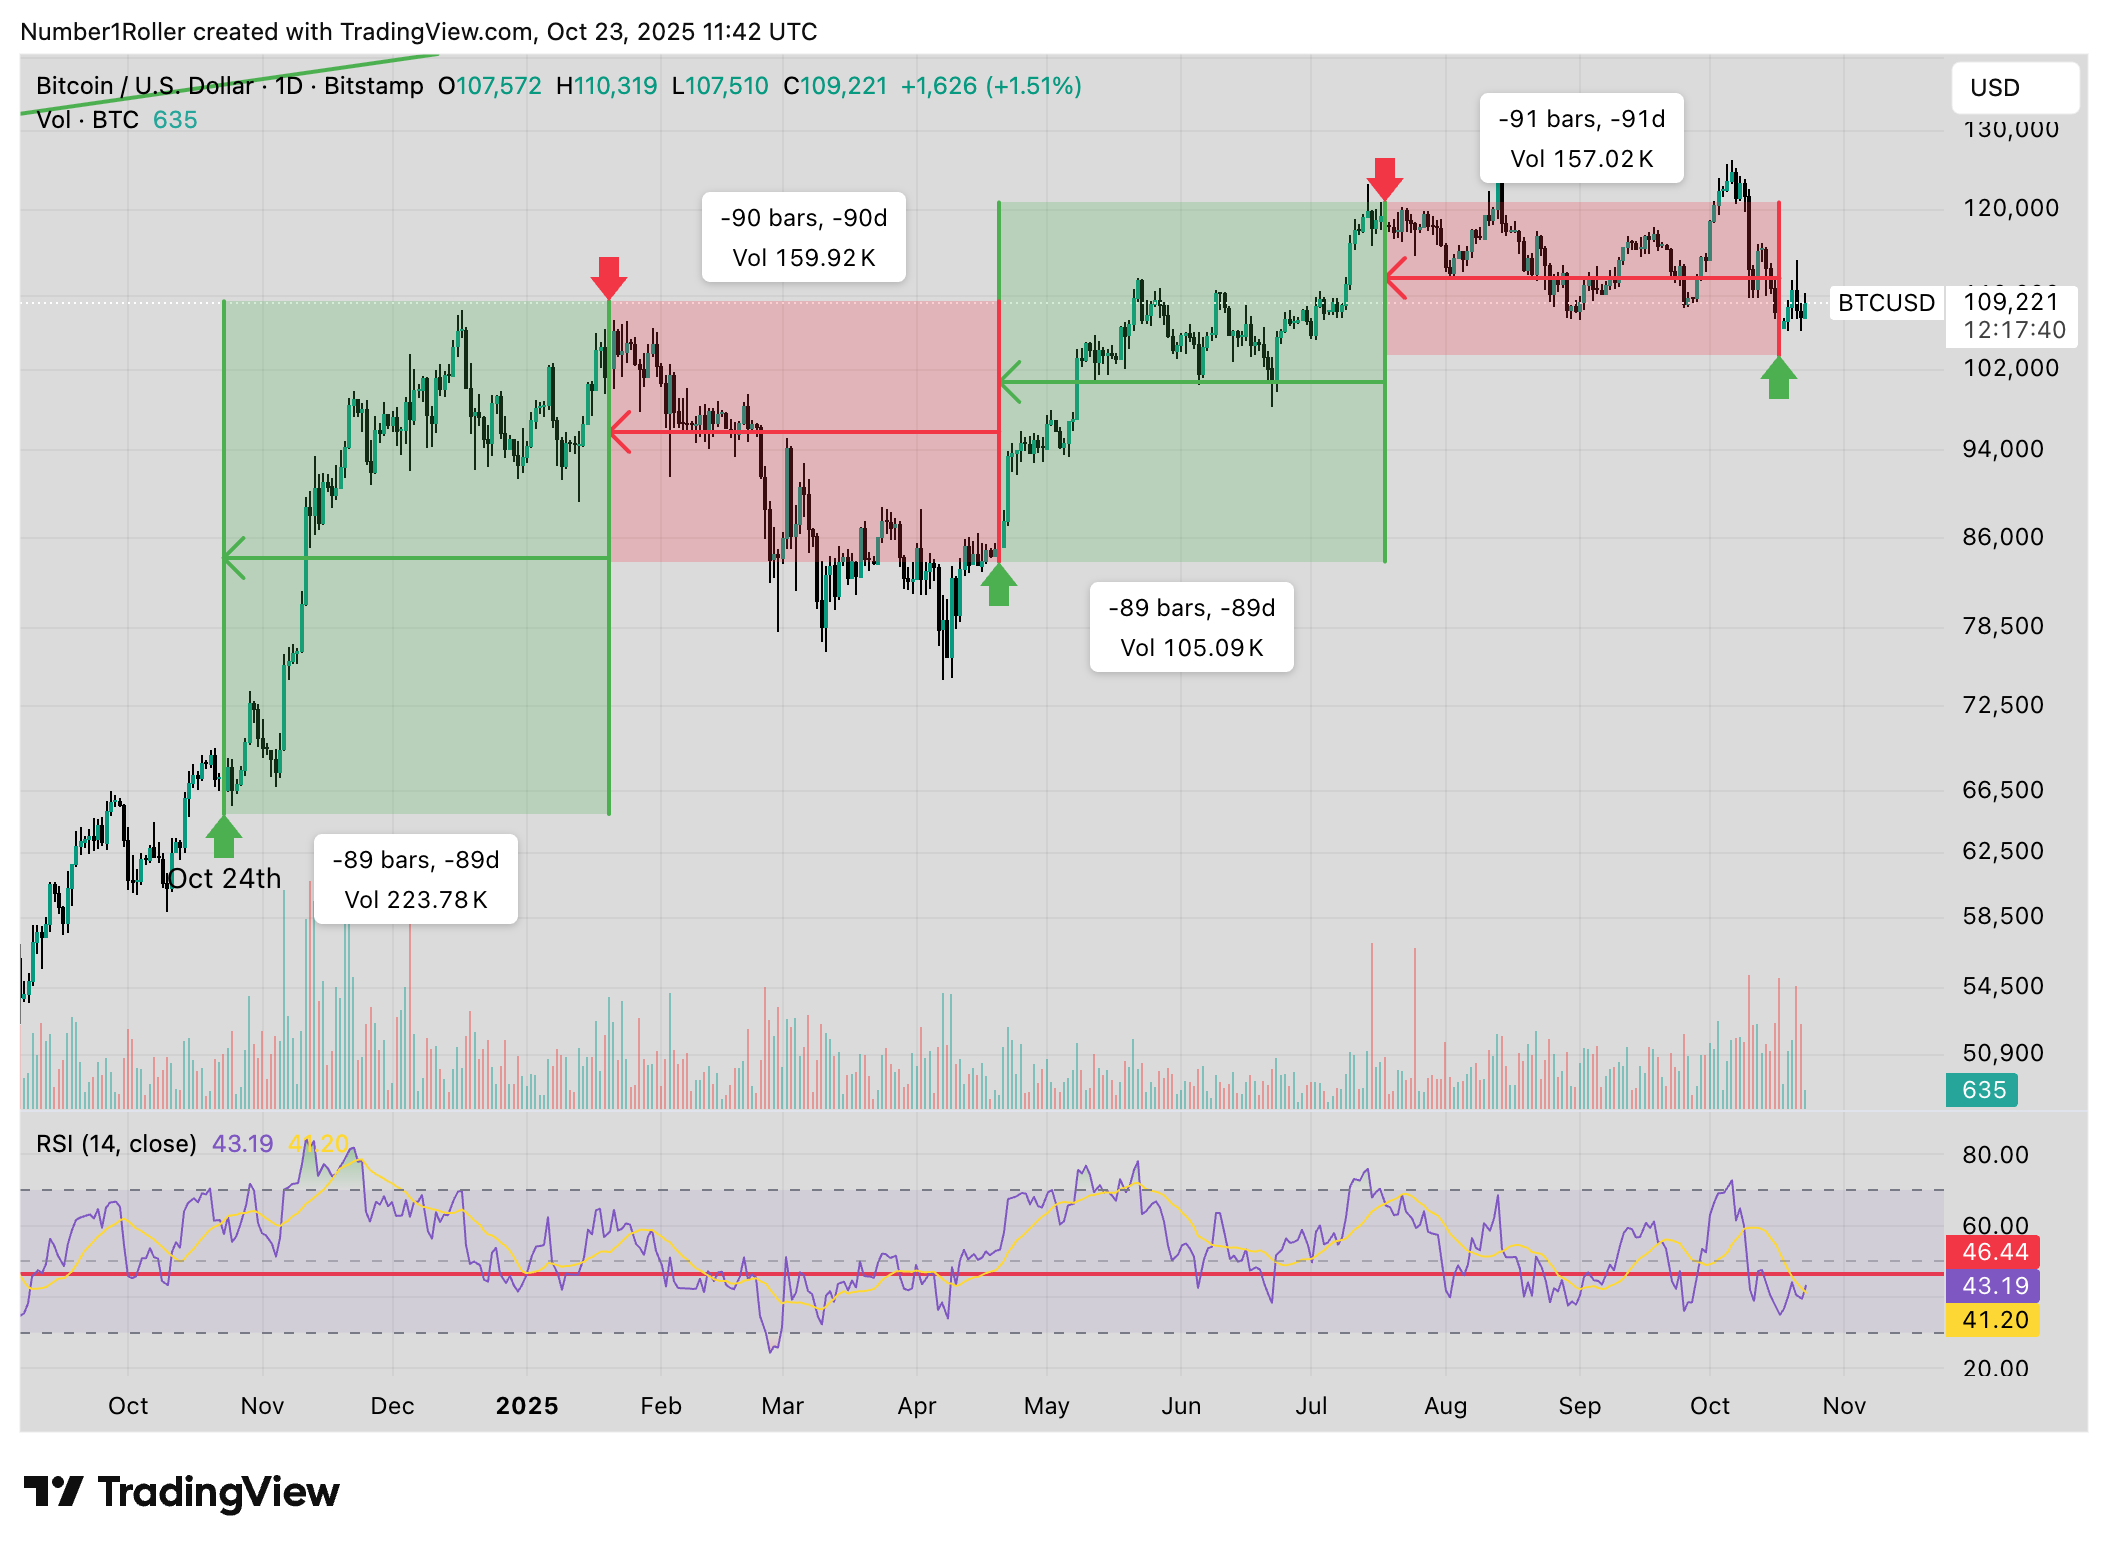
This cycle suggest the low on the 17th was the completion of a full cycle from that October 24th low in 2024.
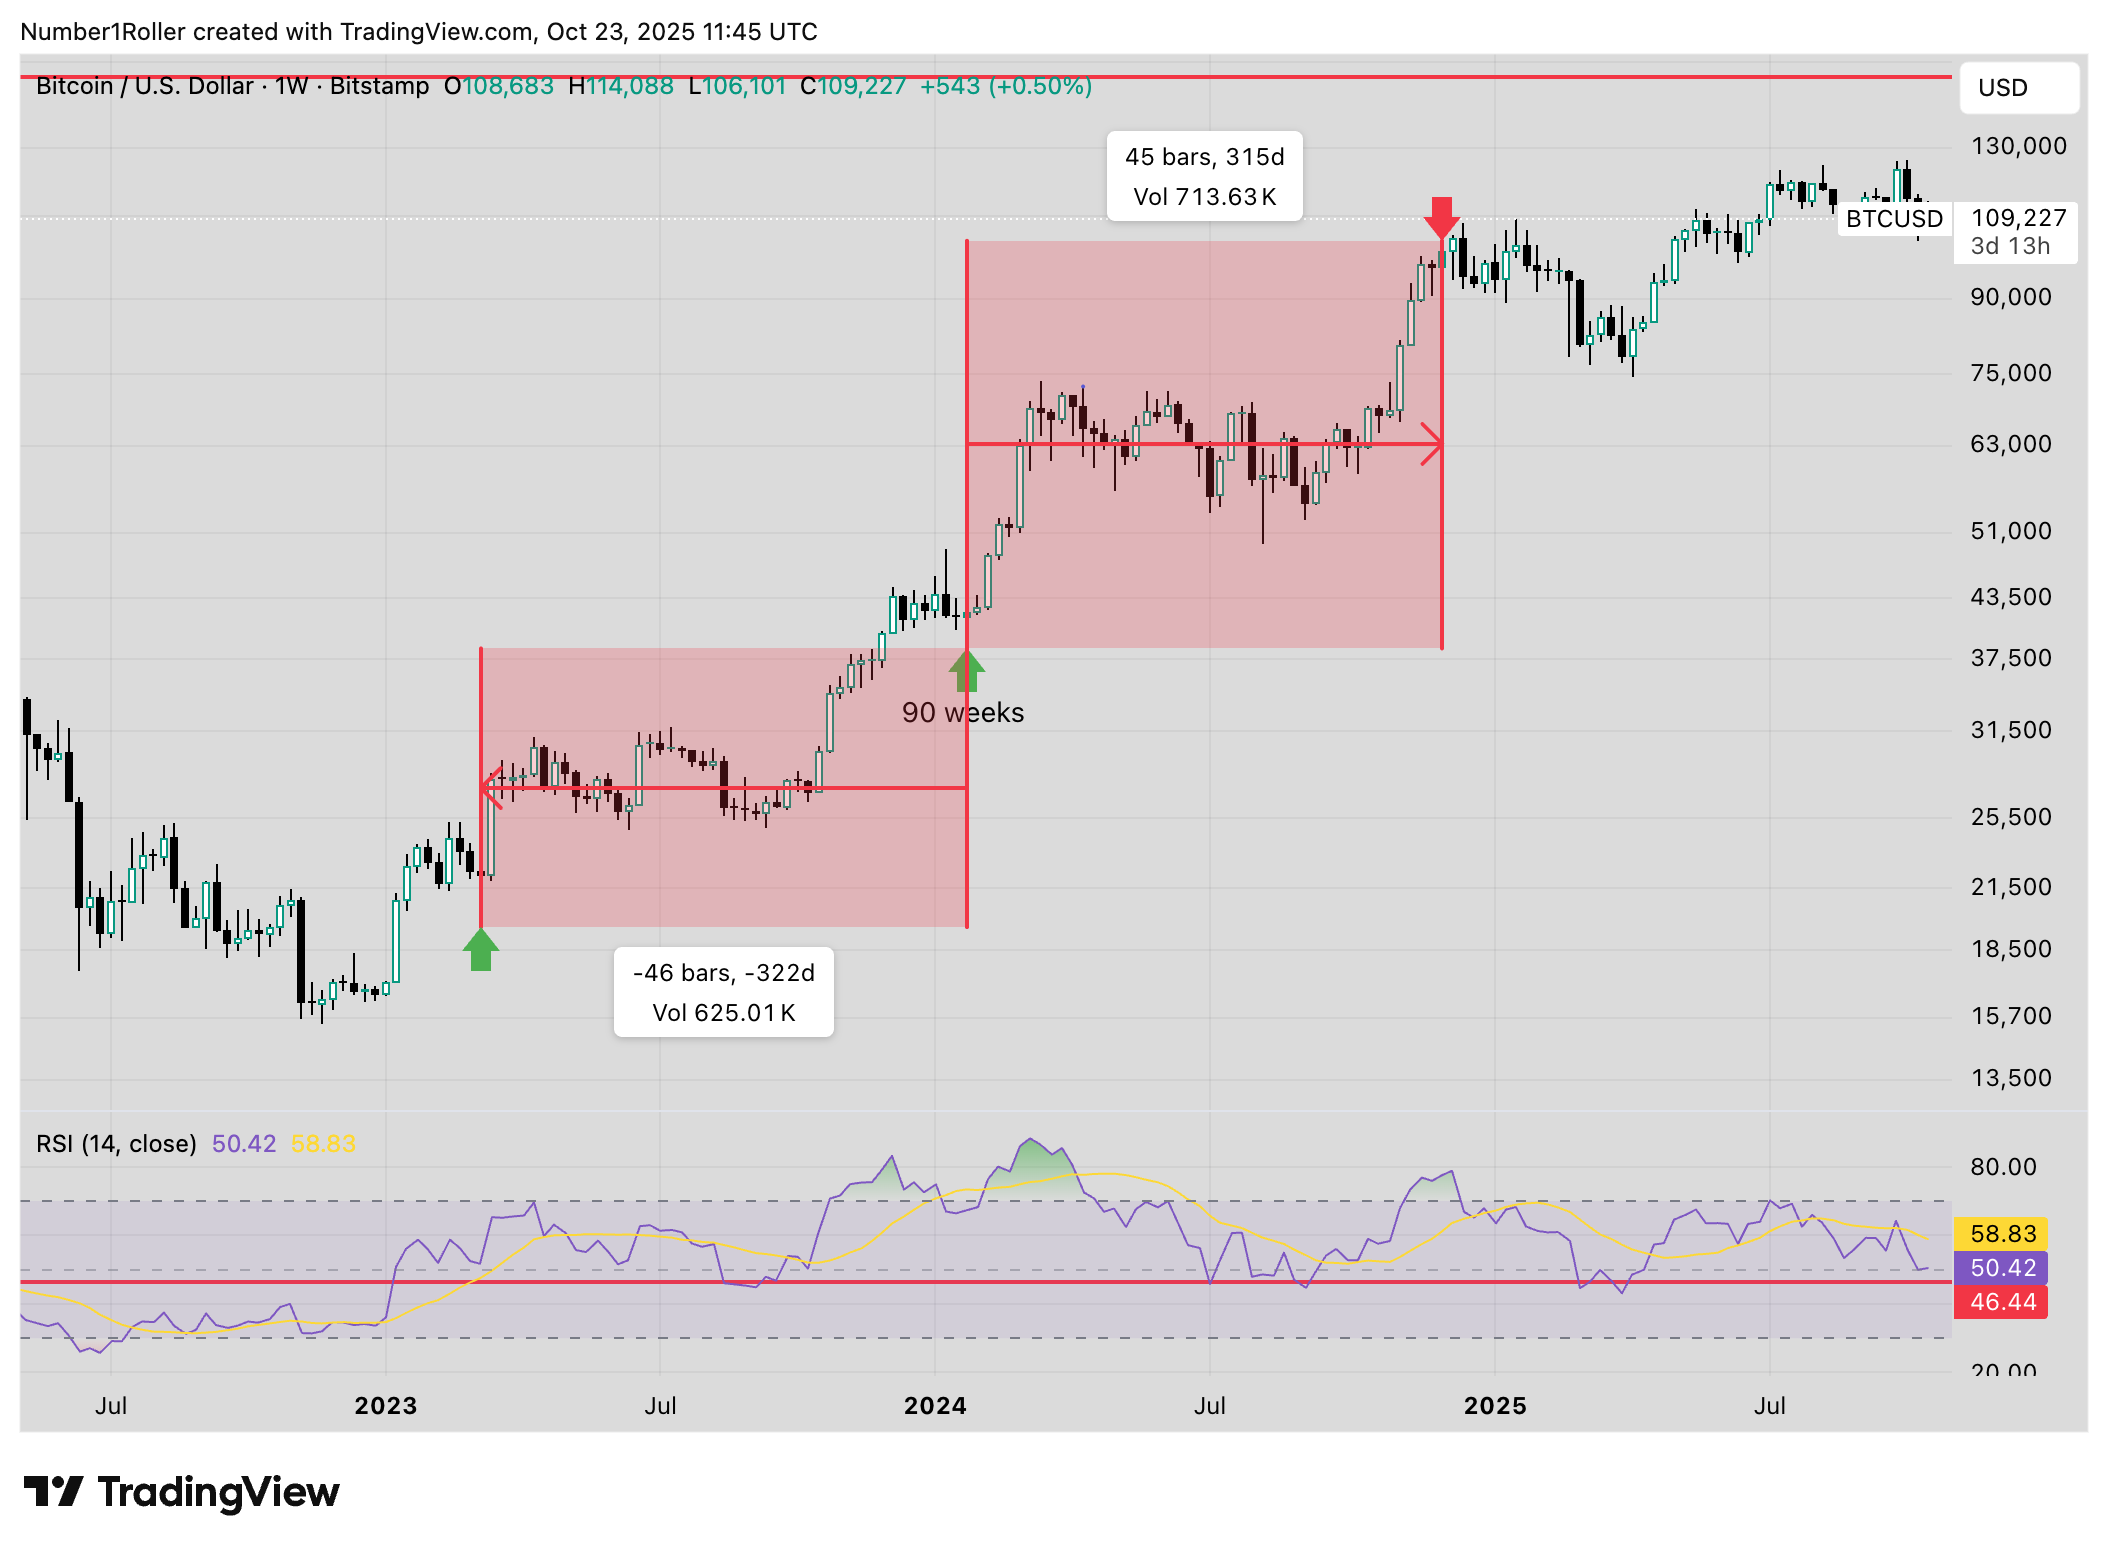
Now we can look to the weekly cycle to see if a 90 day cycle coincides with a 90 week cycle and sure enough it does.
The January 2024 weekly low after the ETF launch was exactly 90 weeks from October 17th 2025.
Furthermore, this all fits into our 45 degree cycles which is half of the 90 cycle and divides the circle up into 8ths.
If we look at the weekly cycles 45 weeks in each direction from that January 2024 low we get the banking crisis low in 2023 (135 weeks) and we get one week off the December 2024 weekly high. Both important market turning points.
That cycle brings us to todays low which falls within these important time factors.
Now if it was as easy as that the market would give us clear setups and simple price action leading into these lows.
Unfortunately its not so simple and the major reason why so many get shaken out at these key time factors because they only look at price and see what appears to be a breakdown.
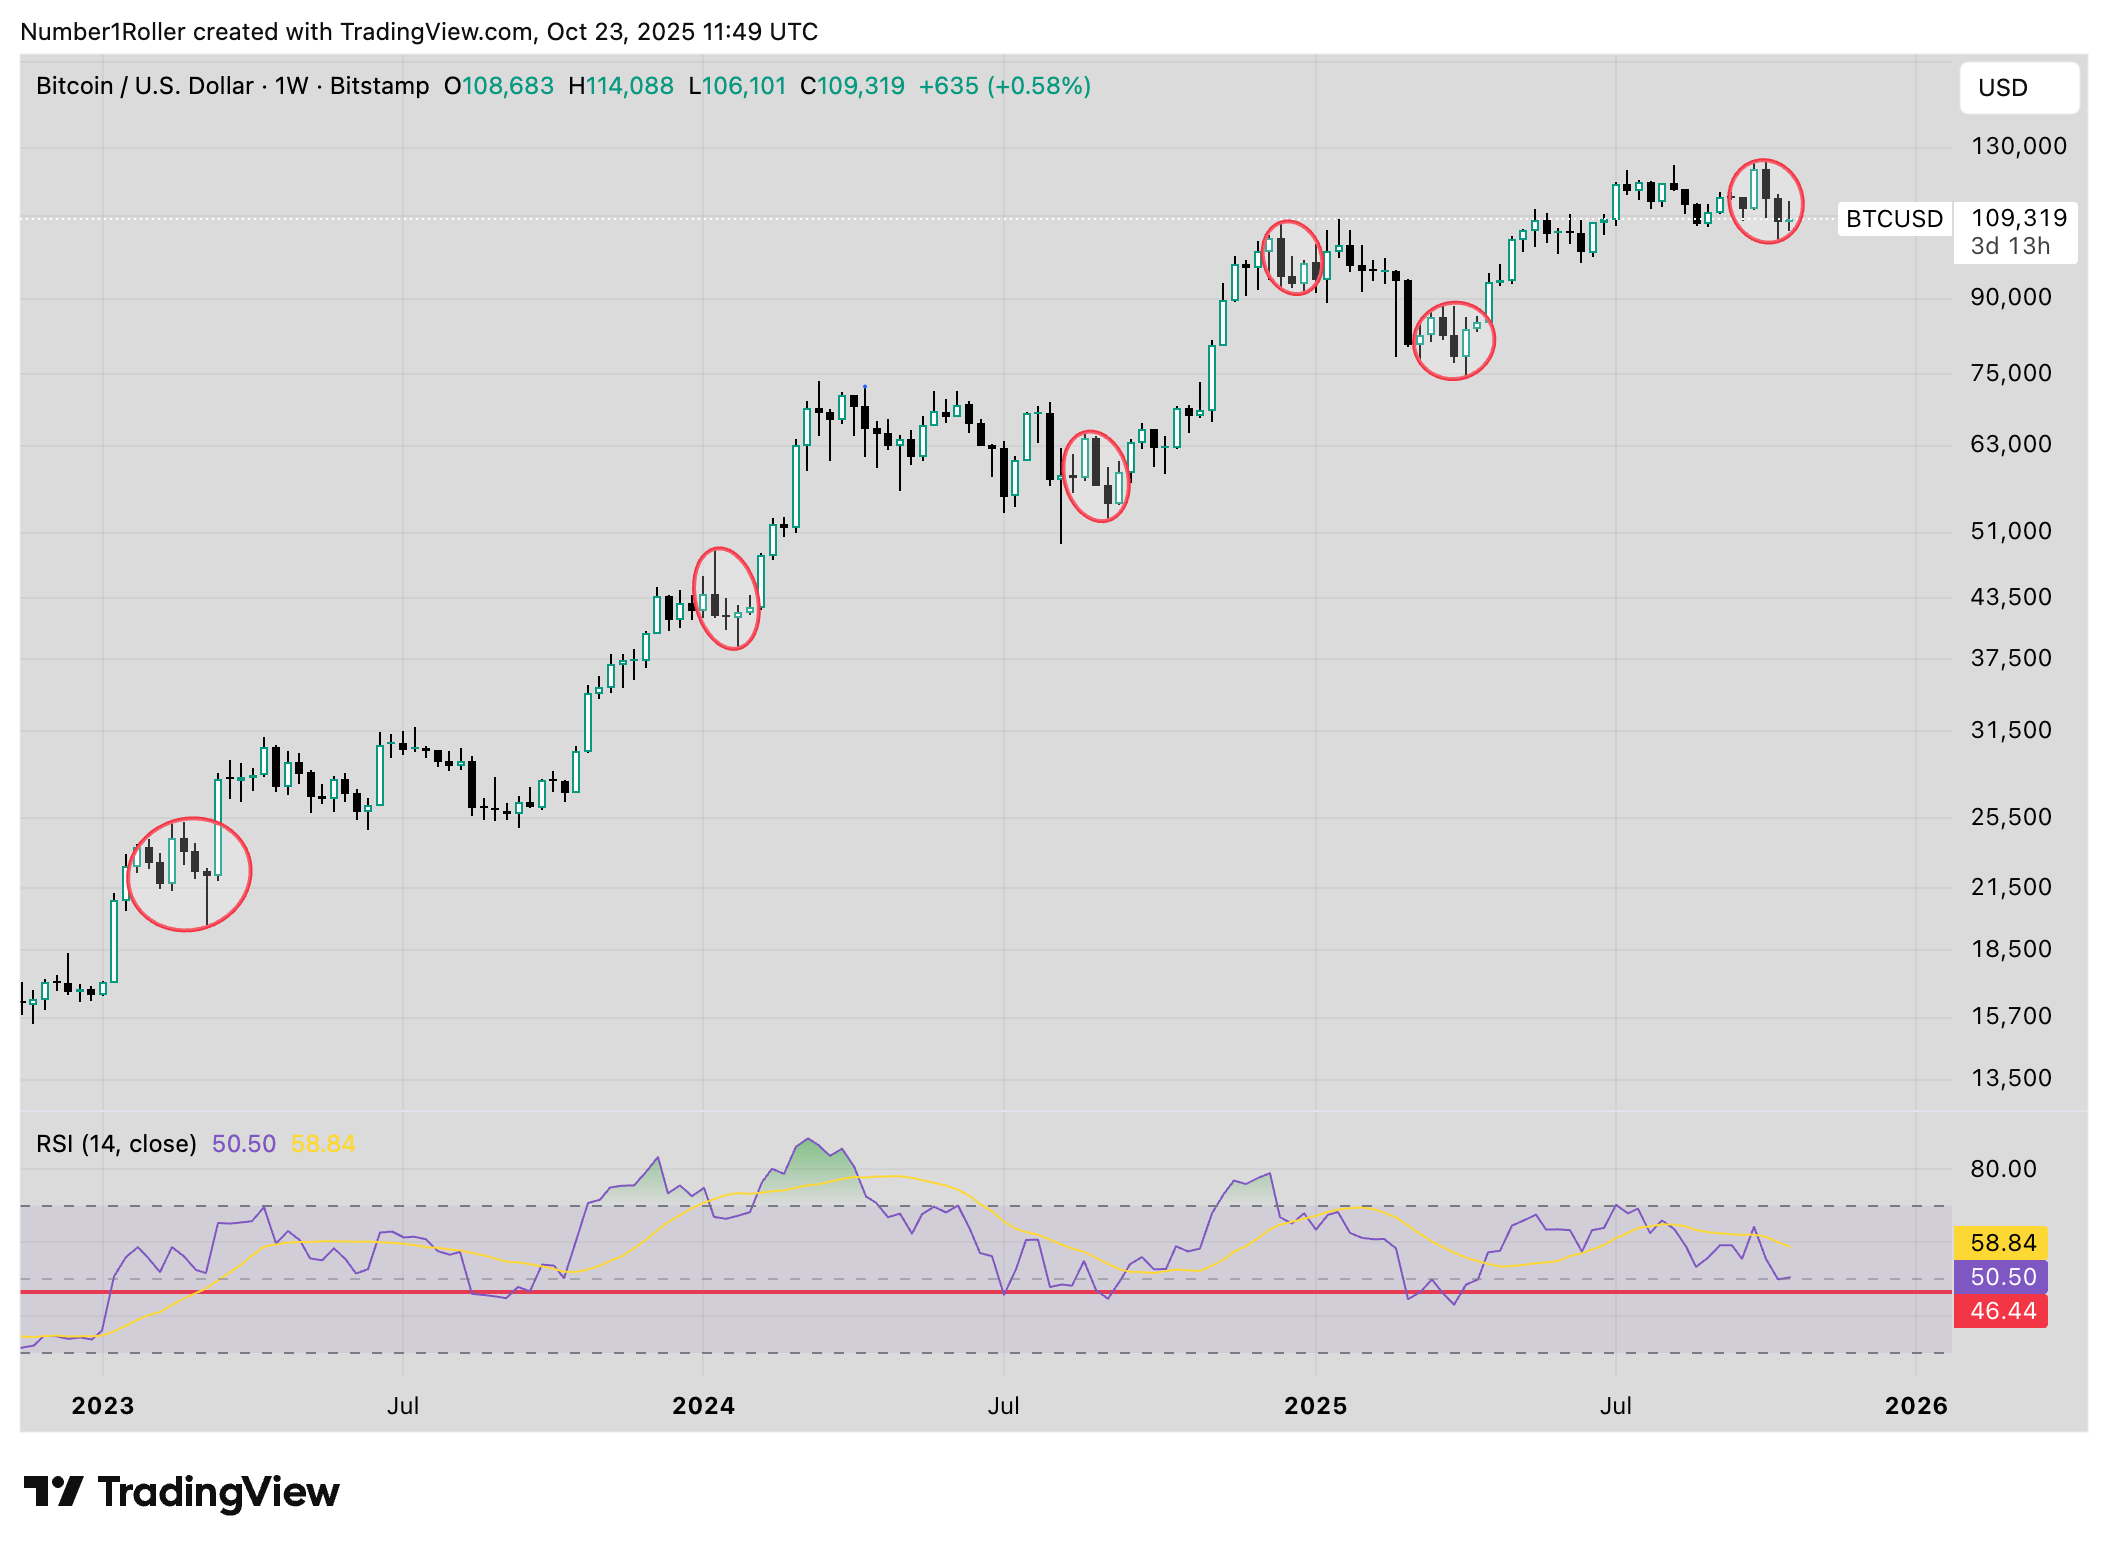
There is a reason they call it a shakeout. Below you can see that every important weekly time factor going back from here 30,45,60,90,135 has resulted in very nasty weekly price action designed to scare people out of the market. Yet what happened after each of these ugly weekly moves? The market reversed higher.
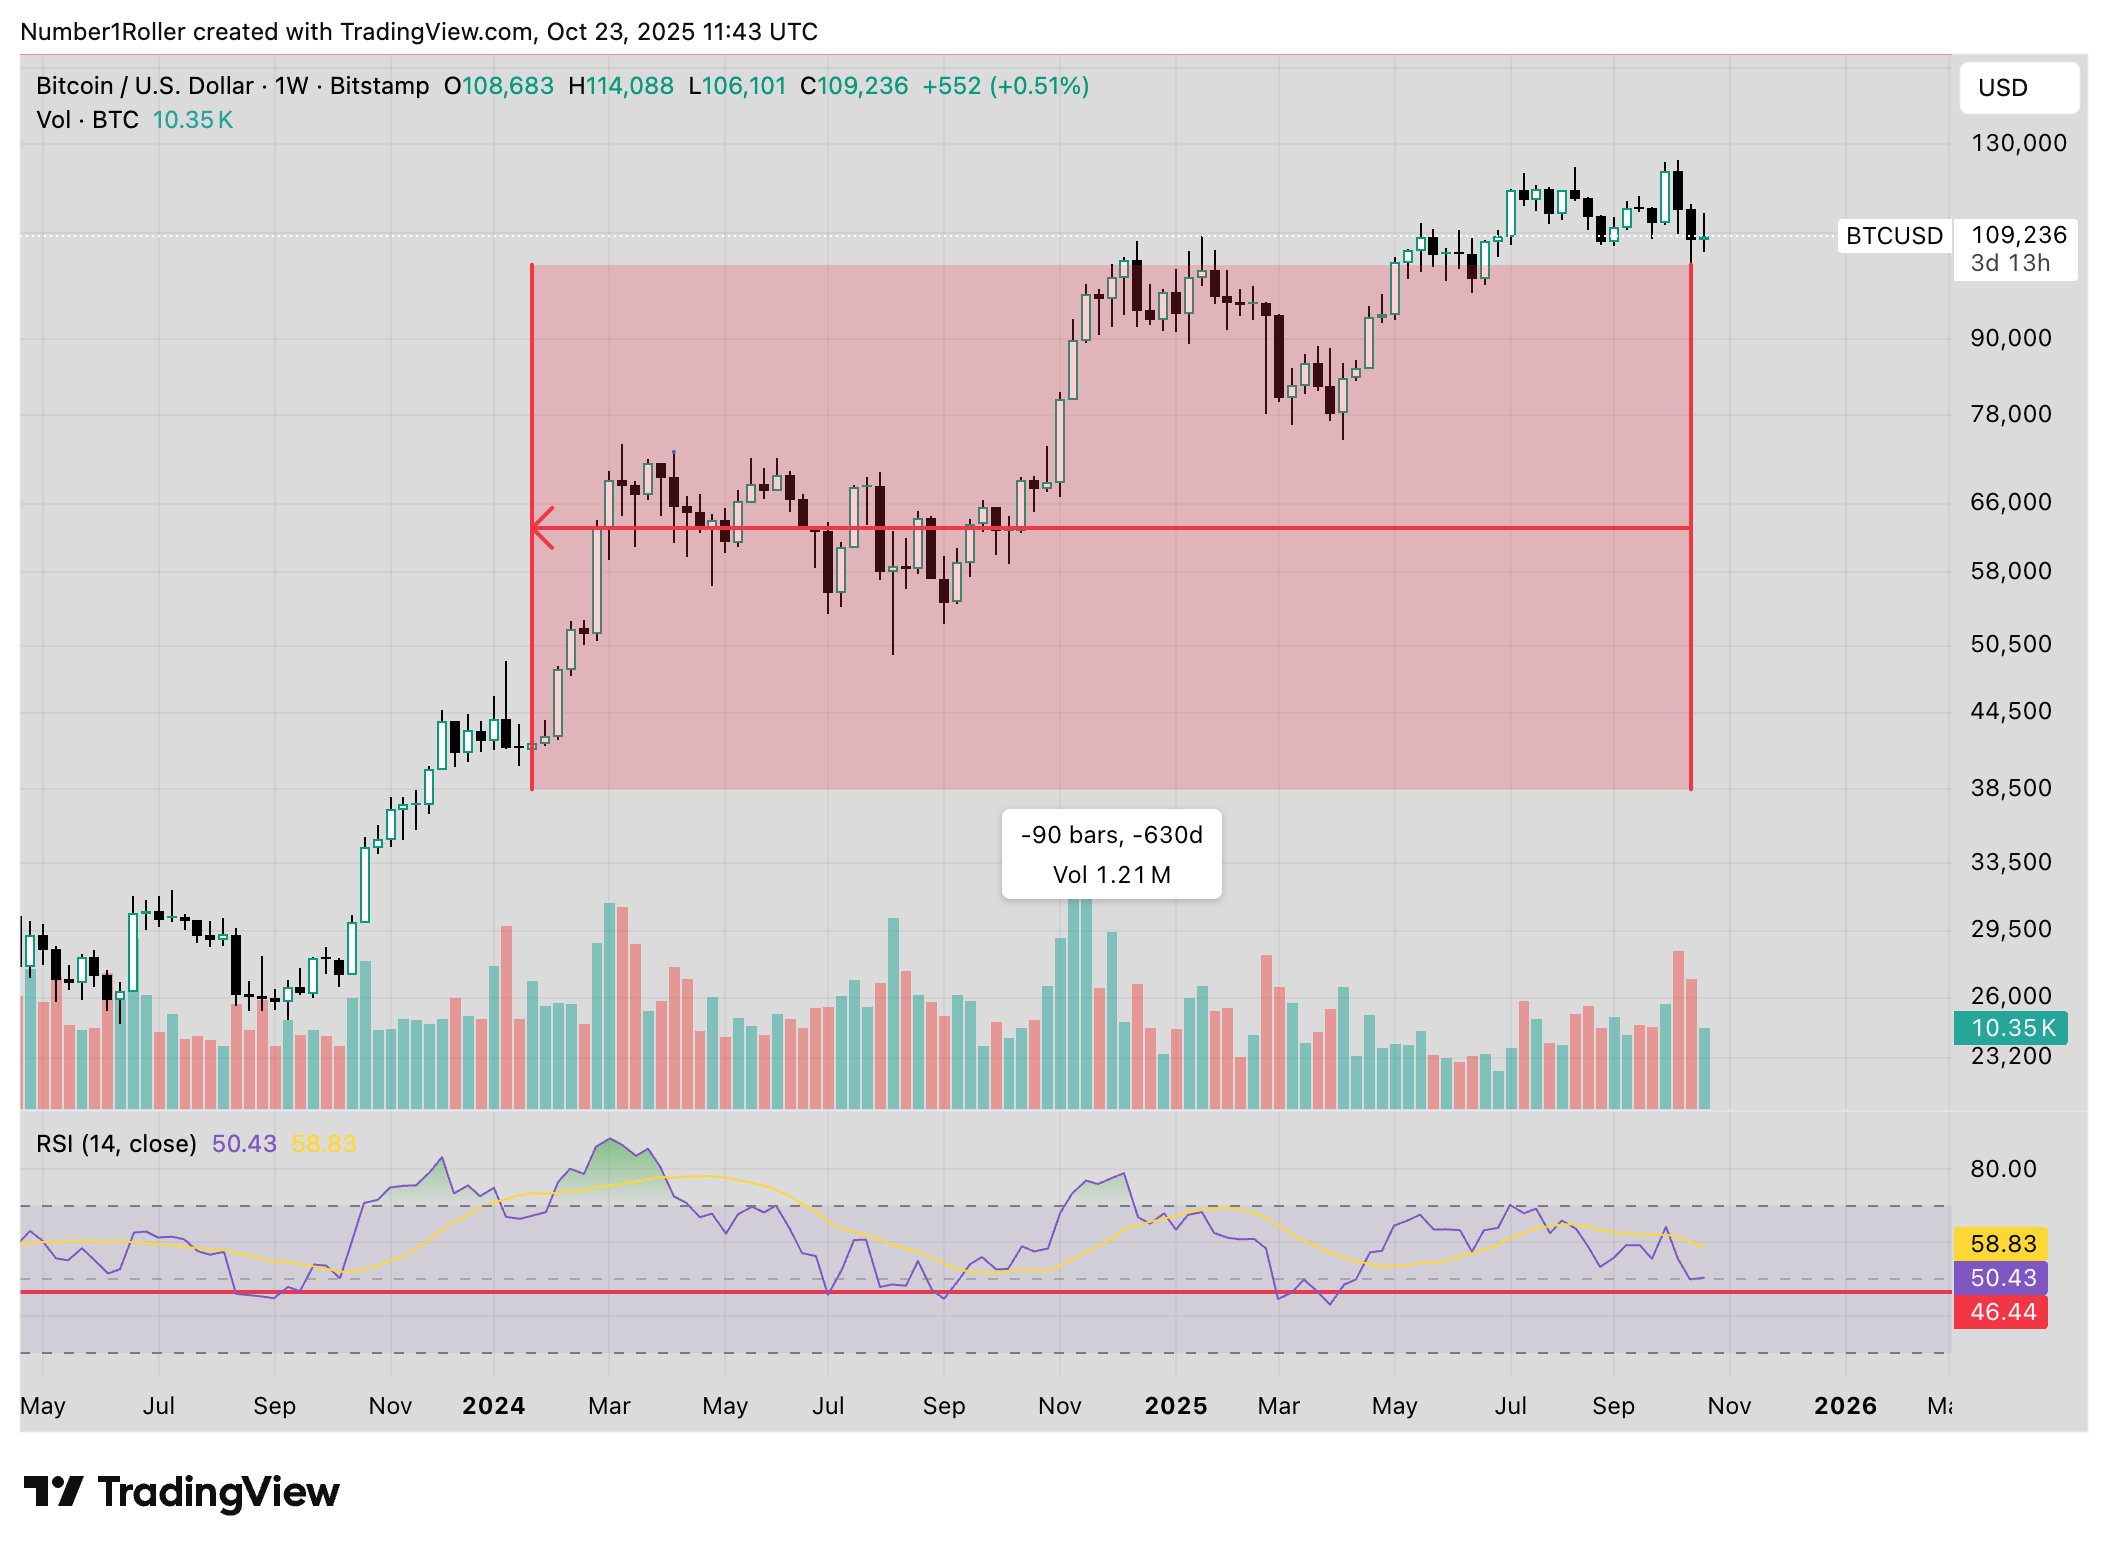
Now if that wasn’t enough to convince us this is a major low we can look further into the monthly chart below where we can see consistent 7 month low to low cycles ever since the bottom of the FTX crash.

That slates this month for a monthly low.
The next chart is a powerful graphic and lesson on market psychology.
The January high price has acted as a significant area of importance every year this cycle. The market seems to always find its way back to grab the liquidity off the yearly open area. This year being no different.

The most interesting part is that this area has acted as both a level of euphoria early in the year and then completely resets to an level of extreme fear later in the year.
This effectively flips into support which was once a level of greed now becomes fear.
The most similar setup from this graphic and price action takes us back to 2023 and 2020. Both of these years which were mostly flat, resulted in huge moves from Q4 into Q2 of the following year.
2023 which you can see below was the last time this market ping ponged in between the green line channel holding this bull market support.
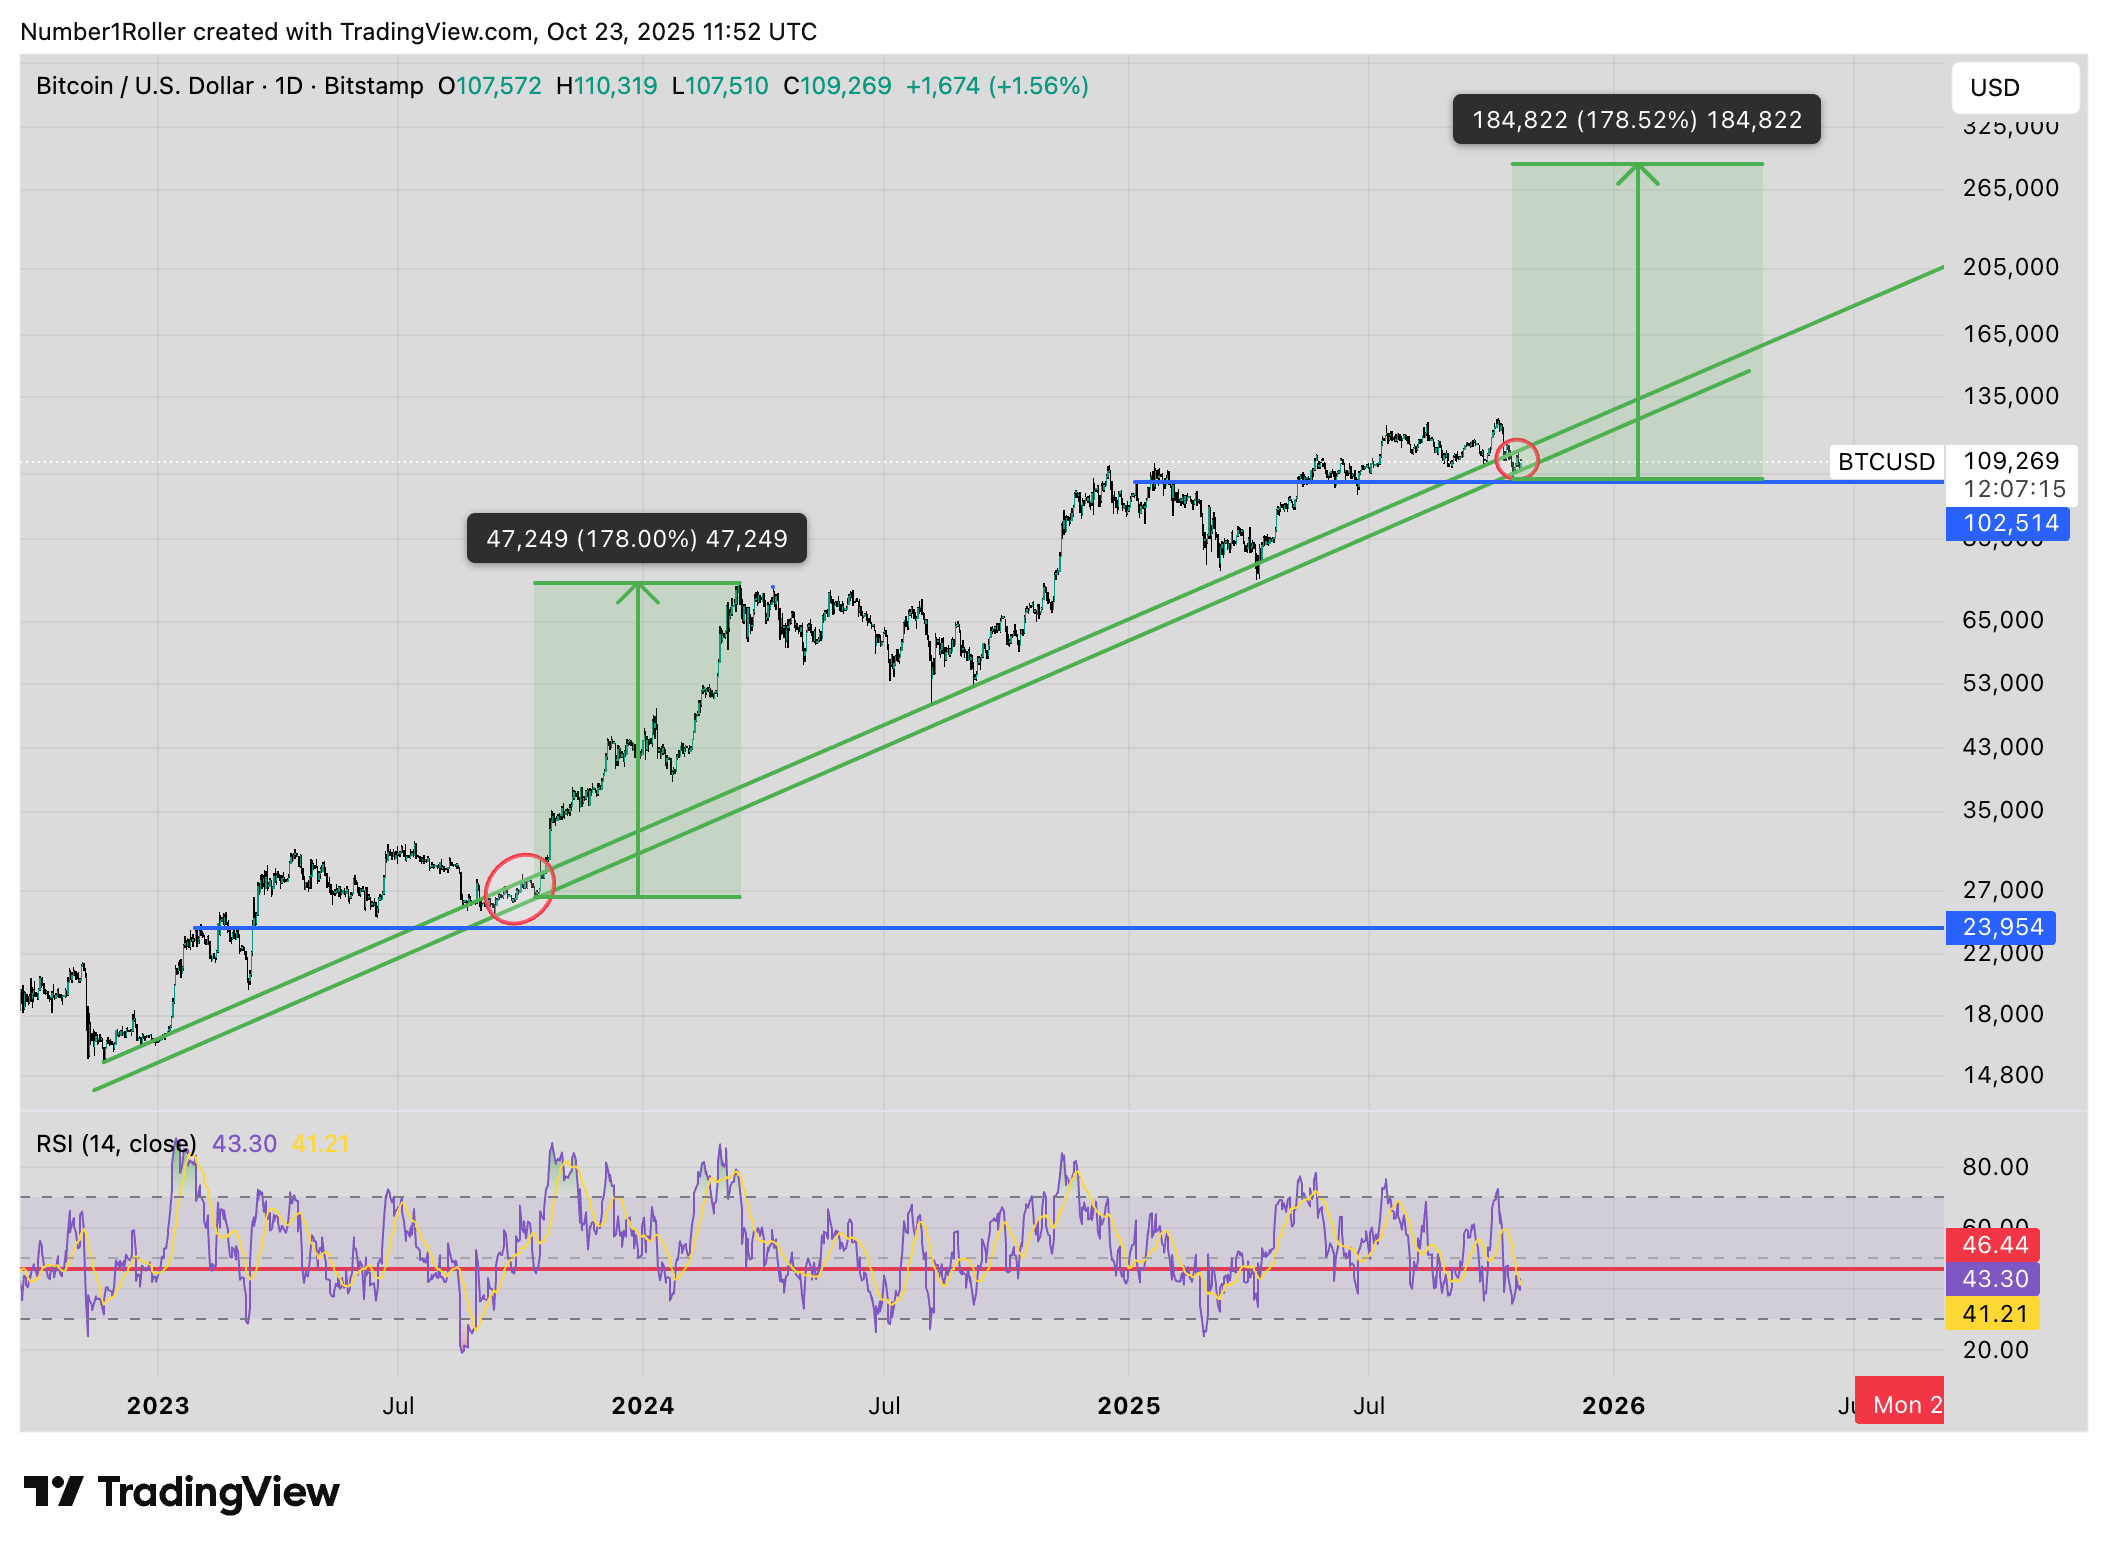
Anyone that was there trading that year can tell you it was debilitating psychologically. A dull year that only seemed to get duller and duller until all hope of a bull run was wiped out by October.
The market precede to explode nearly 200% breaking all time highs far sooner than anyone anticipated. Which is why I believe we are setting up for a similar price shock today.
Finally, we take it back to 2020 and the real 5 year cycle we have been calling out for months now.
People are getting exauhsted and ready to throw in the towel yet we can see that the same structure played out in 2020 that we have been following so closely. Flat again from January to November.
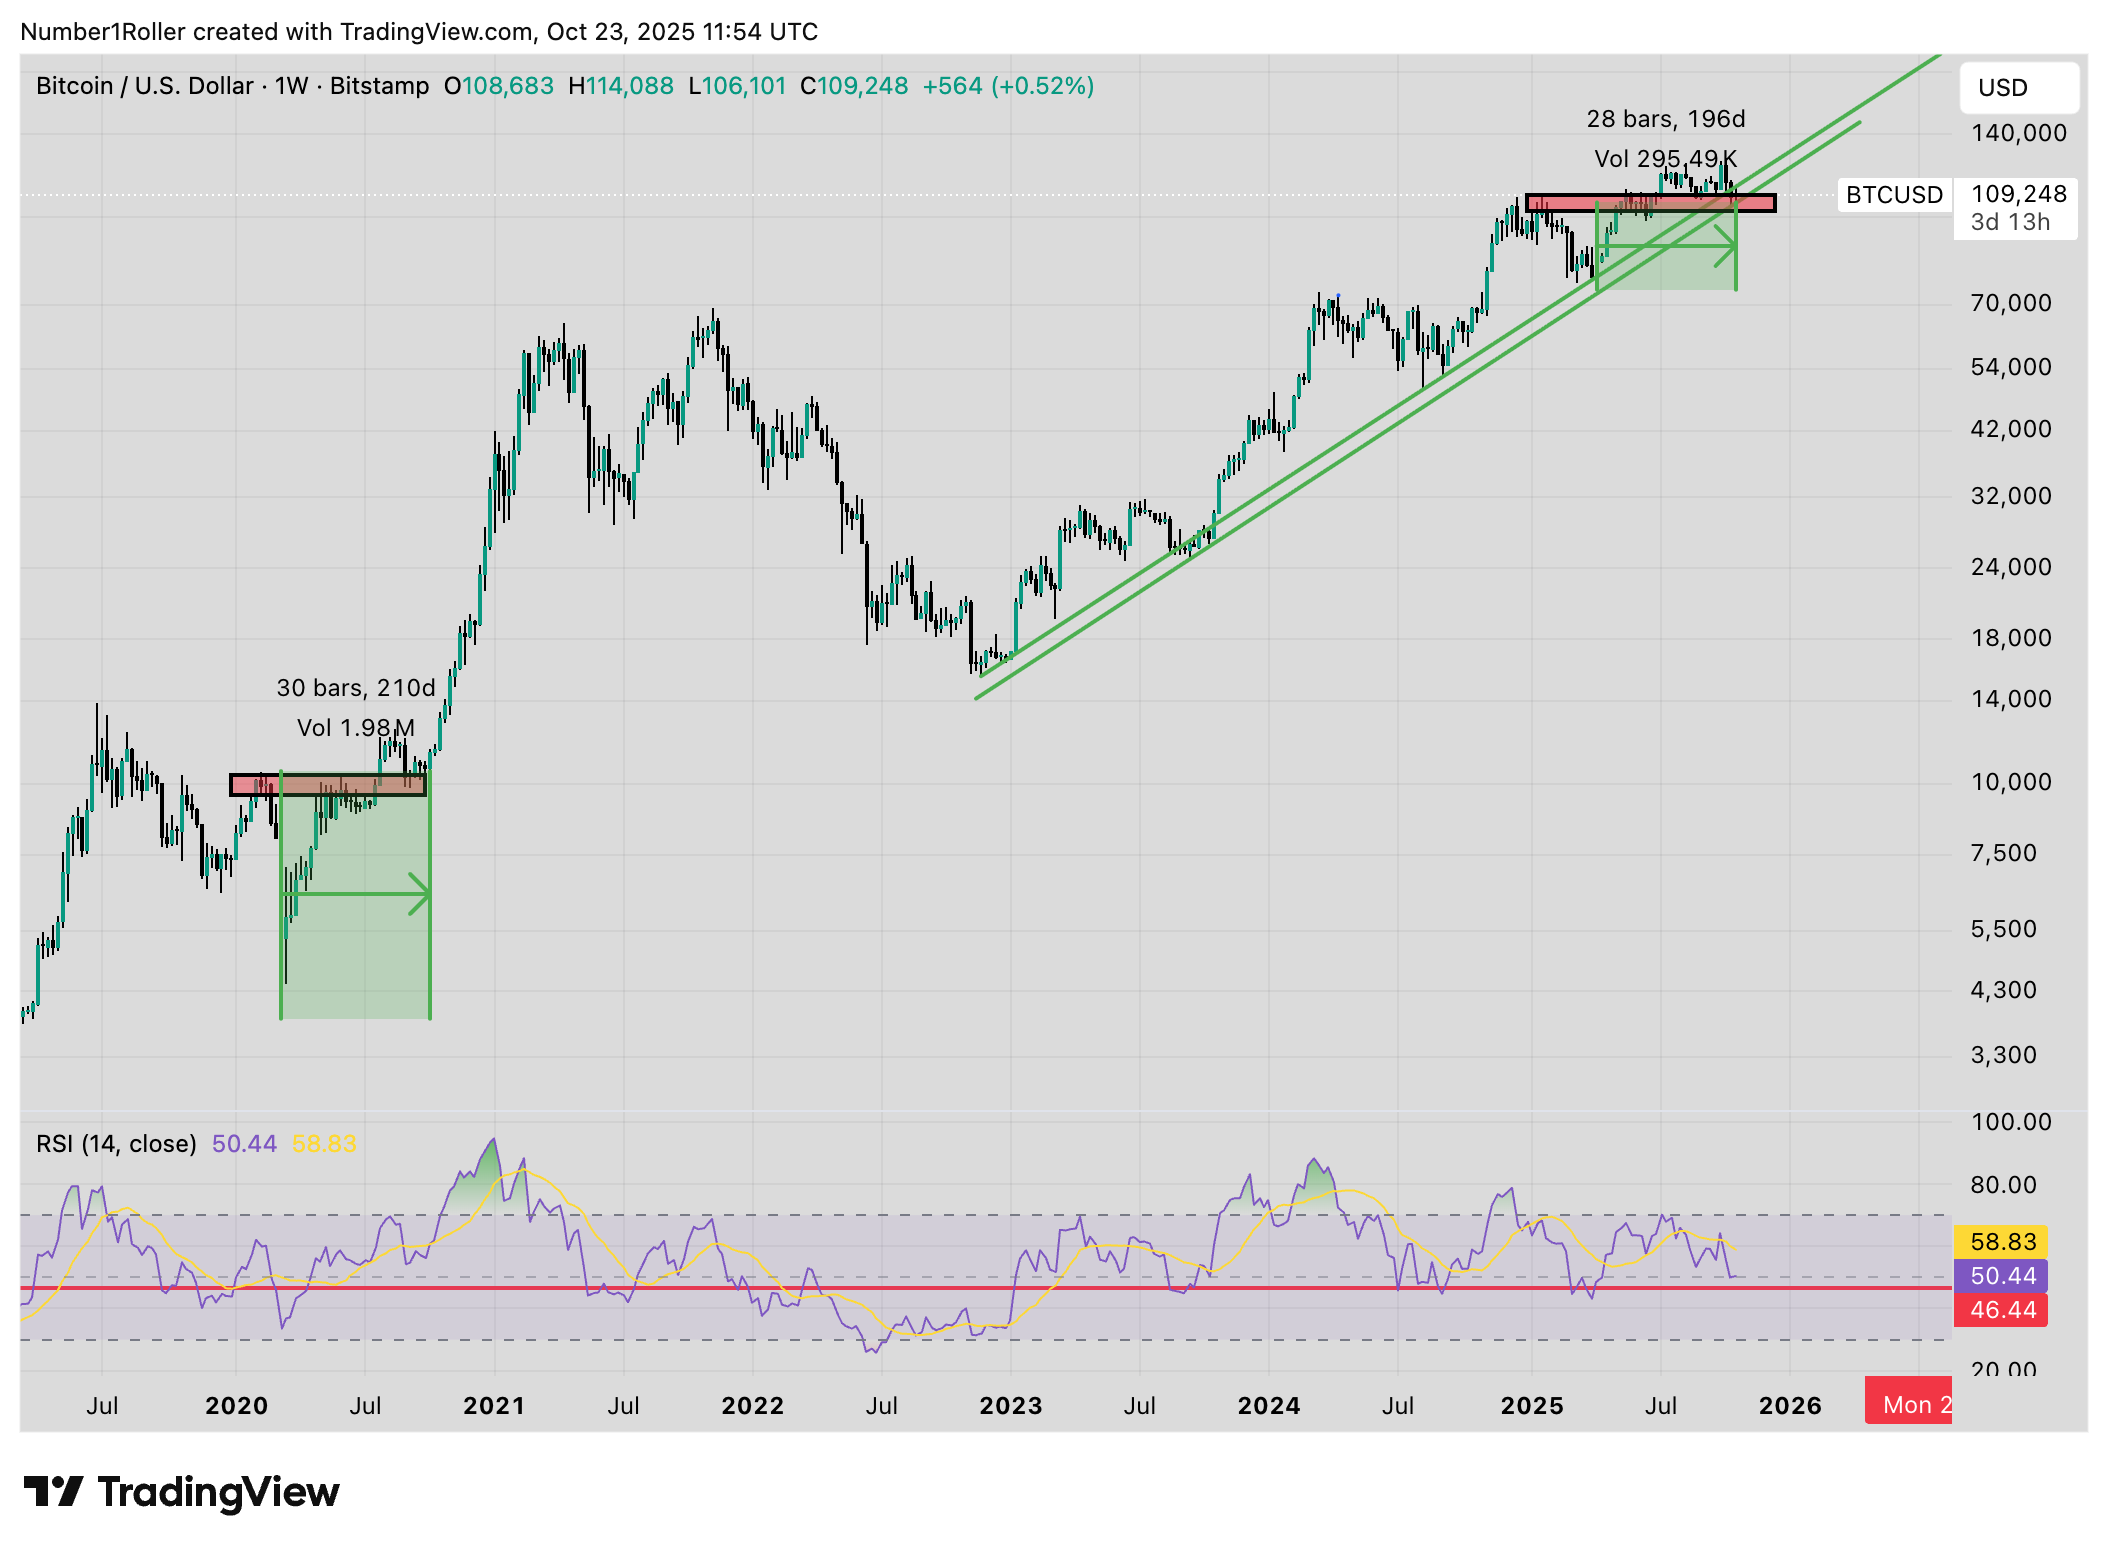
Time is showing that from the Covid crash to the real move up took 30 weeks to begin.
With a very similar crash in April of this year that completely reset the market 60 months from Covid we are still just 28 weeks into the move. Which tells us that nothing is out of sync yet with that 5 year repeat.
In fact that 30 week period will bring us to the first week of November for the real move to begin which is exactly when the big move up began last year and the year before that.
Last year Trump was elected on November 4th and the market rocketed higher. The year before that the ETF news came out the first week of November and the market took off.
So what do we want to bet that there will be some news coming out in the next two weeks for this market to grab a hold of?
The Case for Late 2020
Now that we see the bitcoin cycles lets take a step back and look at how the macro setup is leading us into a 2021 style move.
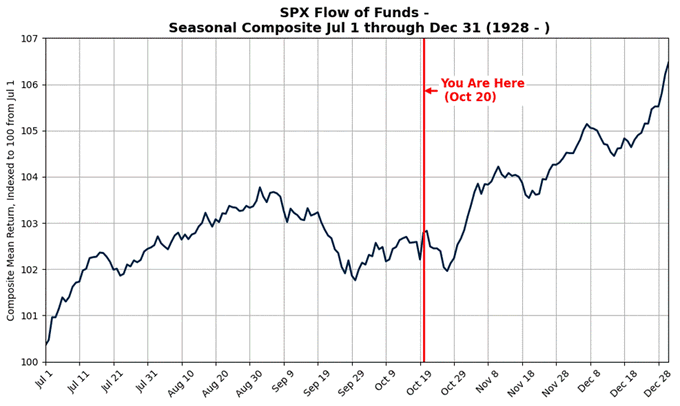
If we start with this simple cycle chart of the S&P (which we have been calling out all year long) you will see that the September/October sideways move is playing out just as our cycles suggested and favoring more upside to start in November.
People have totally lost their cool on a Q4 rally because we are already one month in but they can’t seem understand that it has played out this way for nearly a century.
Looking at the S&P composite chart going back to 1928 it tells us that the year end rally typically begins in the last week of October. That’s exactly what happened in 2023 and 2024 with the year end rallies on stocks, they both started in the last week of October.
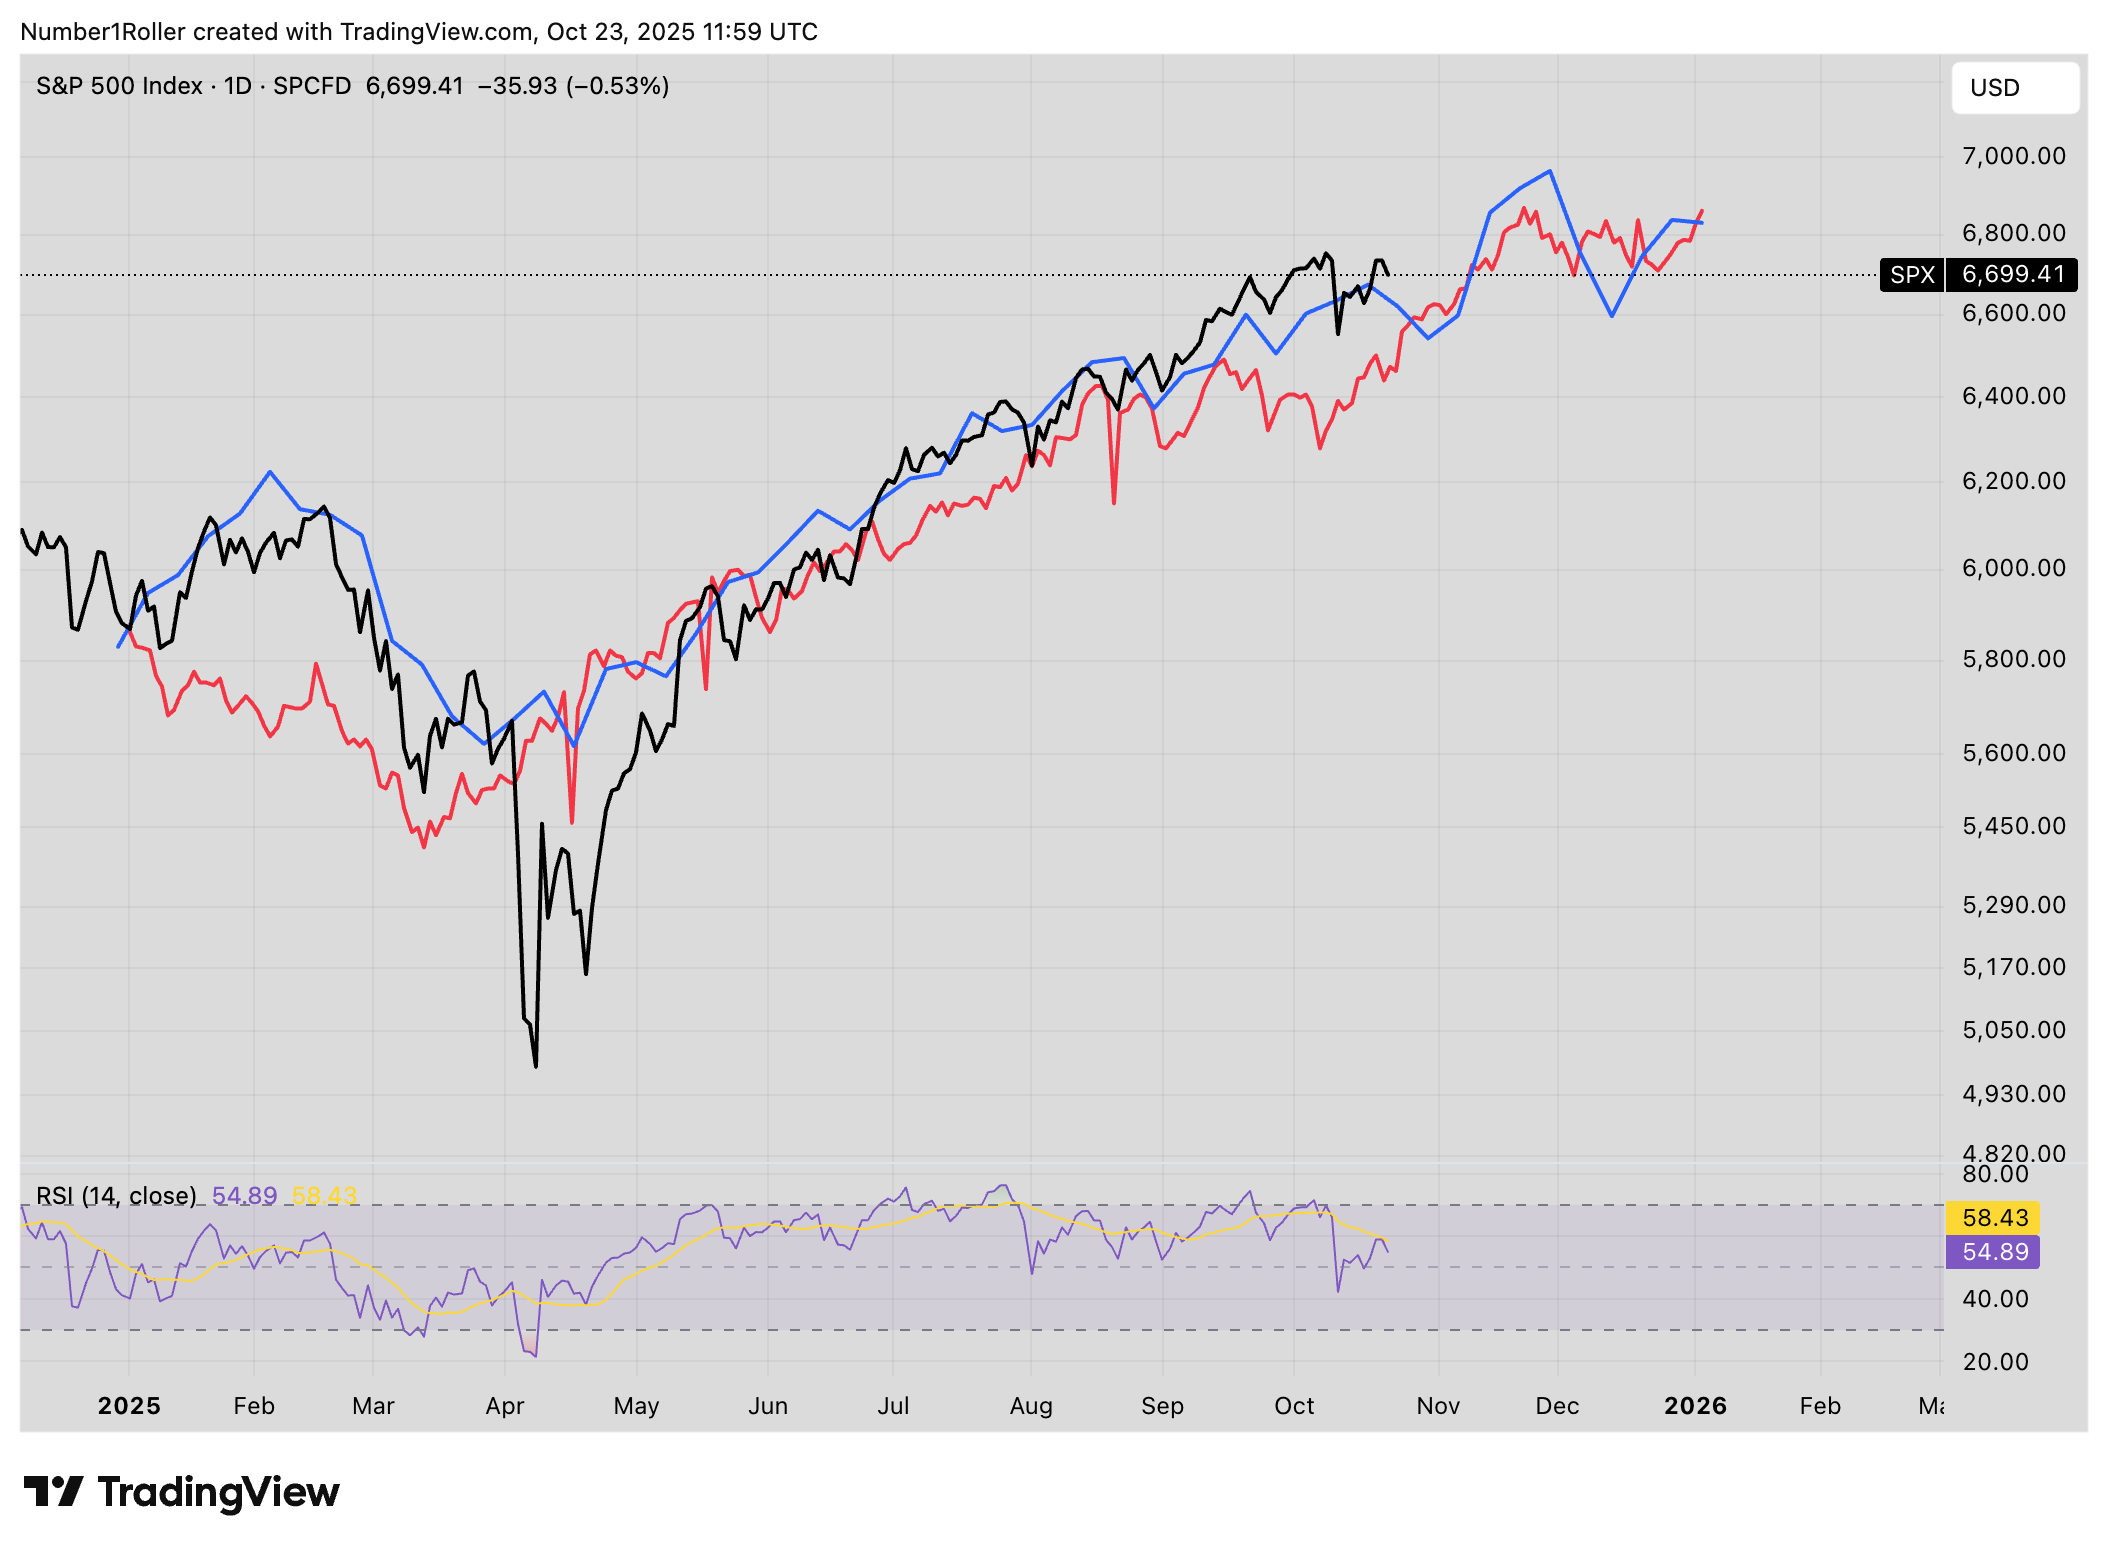
But what about 2020 how did that play out in equities before the huge crypto boom?
Well look no further than the comparison below. 2020 on the left and the exact same time period in 2025 on the right. Similar to say the least.


BTC vs GOLD
It’s not just stocks that have been stealing the show from crypto this year. Gold has caught so much attention that people have been lining up in the streets to buy it like its 1849.
Below we can see how similar a time frame has played out when compared to the 2020 run up in gold. 24 months exactly from low to high. Now I’m not analyzing gold for a top or any sort of call here I’m just pointing out the exact equal time ranges of these moves bottom to top.
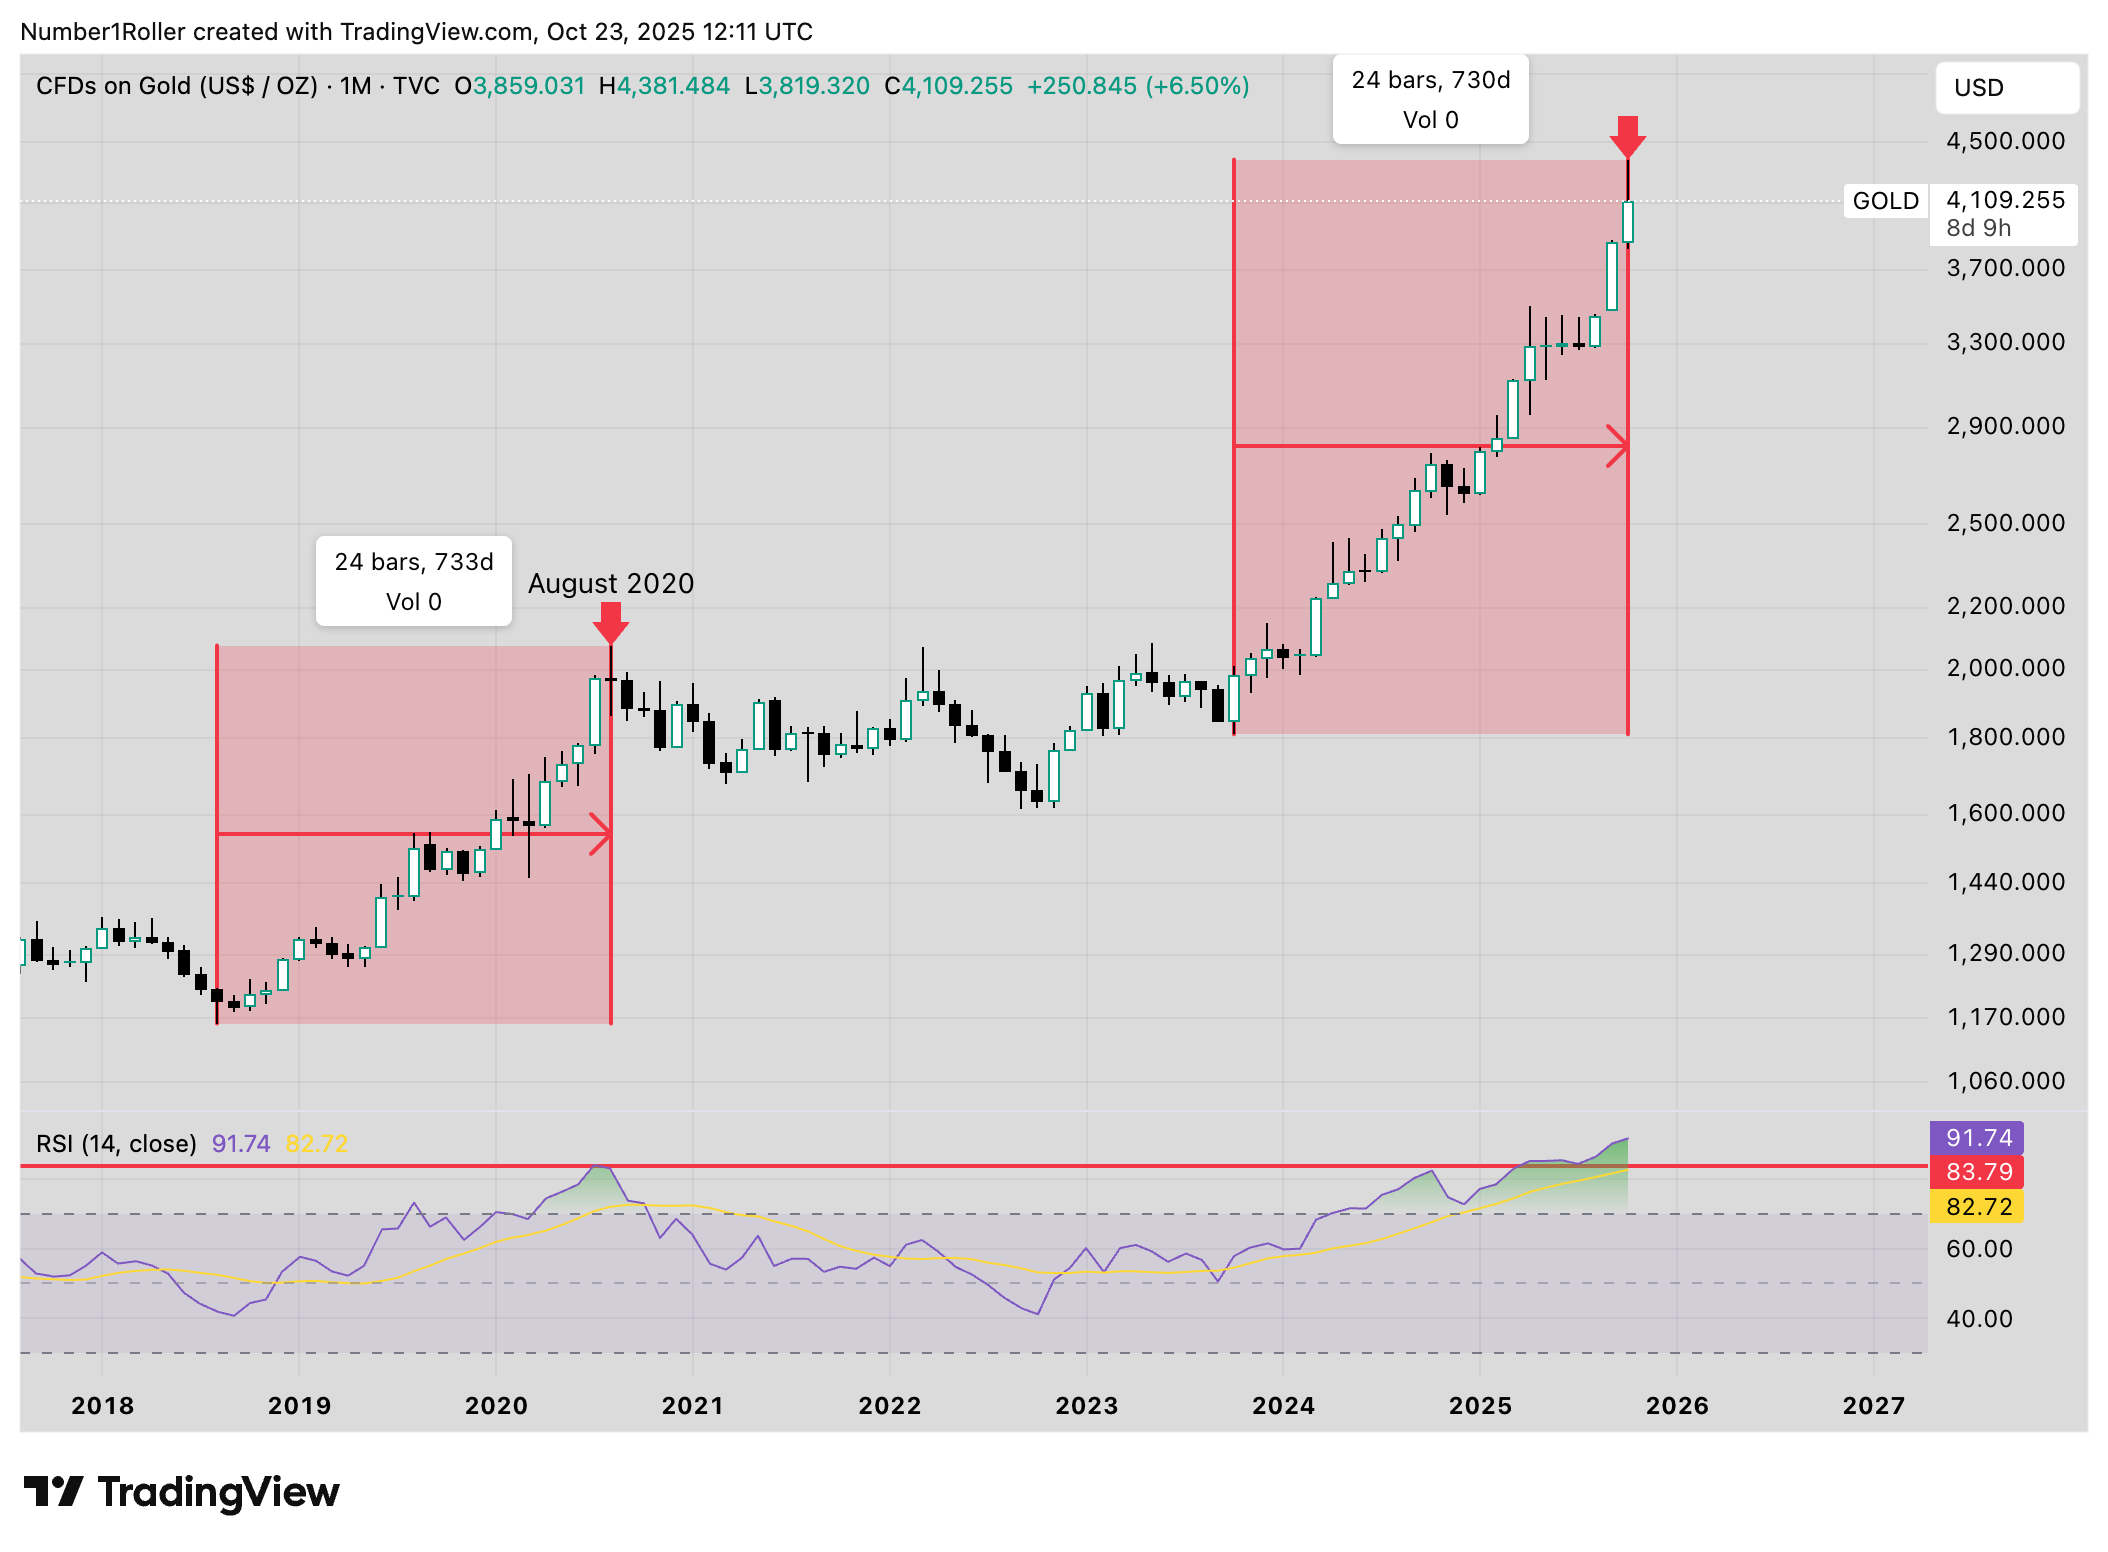
If we plug those points in on the BTC vs gold chart, below is what you get.
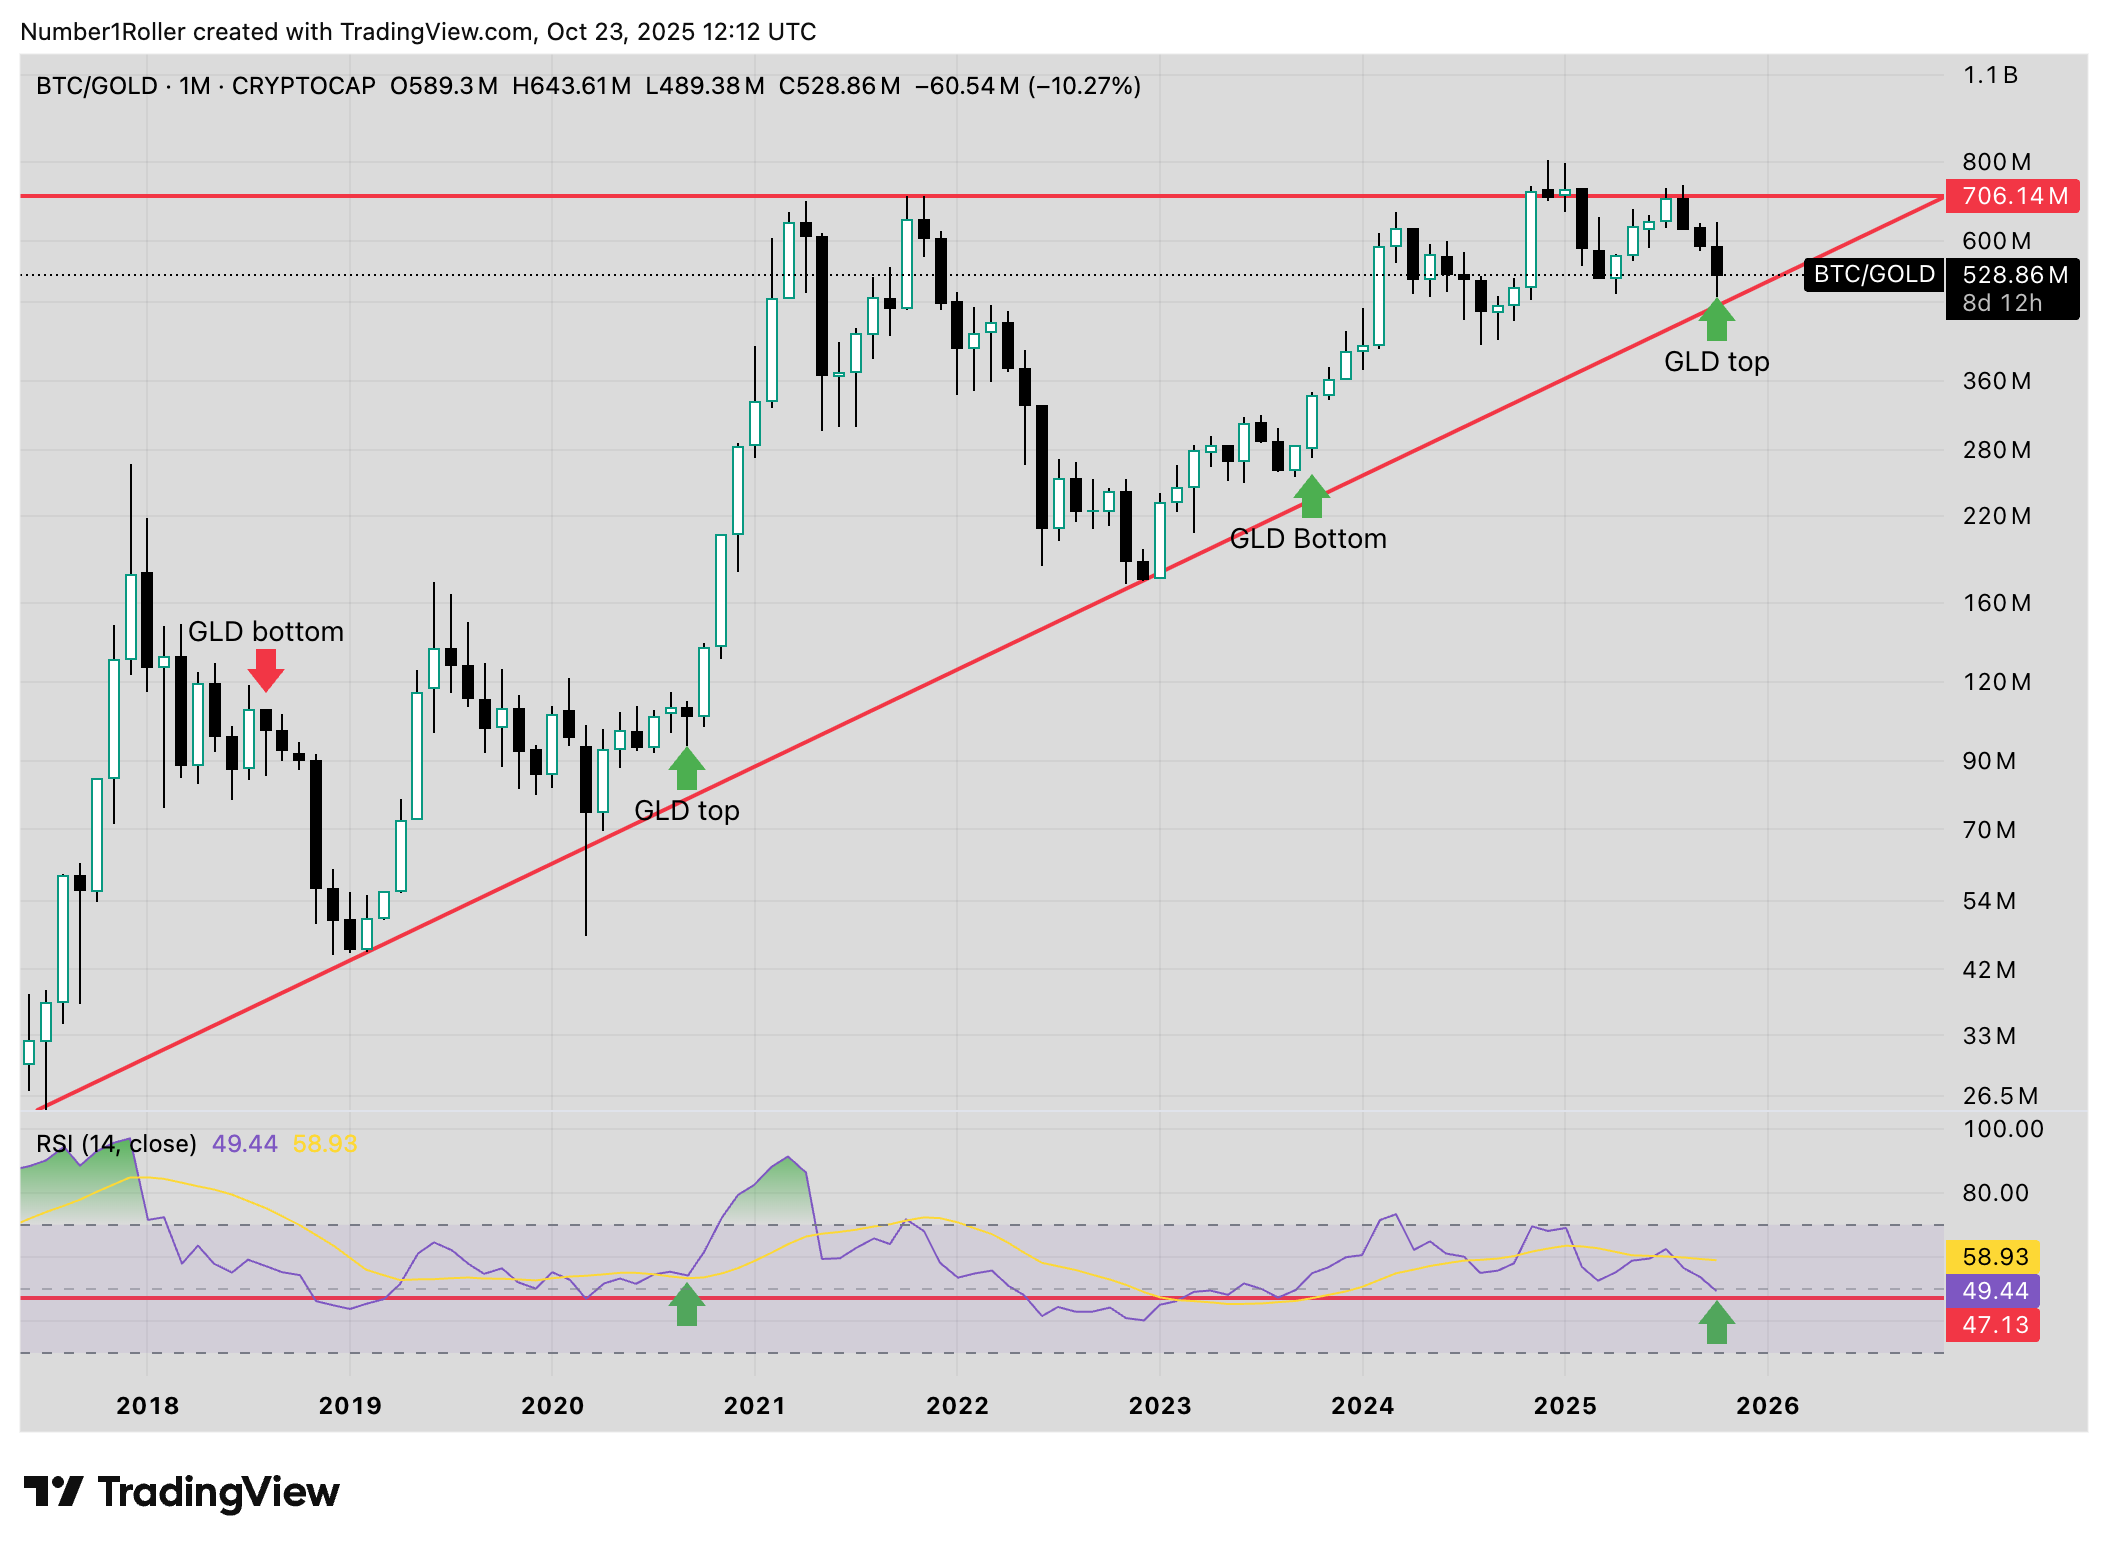
You can see the exact same 24 month run up in gold aligned with a major move by Bitcoin coming off that top in 2020. Today we are 24 months into the gold run and BTC is at its same point in the cycle just before the major run.
Resurgence of MEME Mania and IWM

The final nail in the coffin for this macro view of the five year cycle being under full steam is the resurgence of meme stocks and small caps.
If we look at the GME progression from mid 2020 bottom to full blown mania we are seeing a very consistent pattern in time from meme stocks this year. It is something we have been tracking closely due to its correlation with the five year cycle.
Below is GME in 2020 and KSS today with the green arrow highlighting the final October low before the parabolic move higher.


Most people forgot about the DORK stocks a week after the initial hype but they have quietly been on a steady squeeze higher ever since. There are countless others beginning to emerge like BYND which is why I got the above notification from yahoo finance the other day.
And if that weren’t enough to tell you the animal spirits are rising Roundhill just brought back their MEME stock ETF this month that had previously shut down after a late launch in 2021 marking the top. If time is correct I believe this go around they are early to the game.

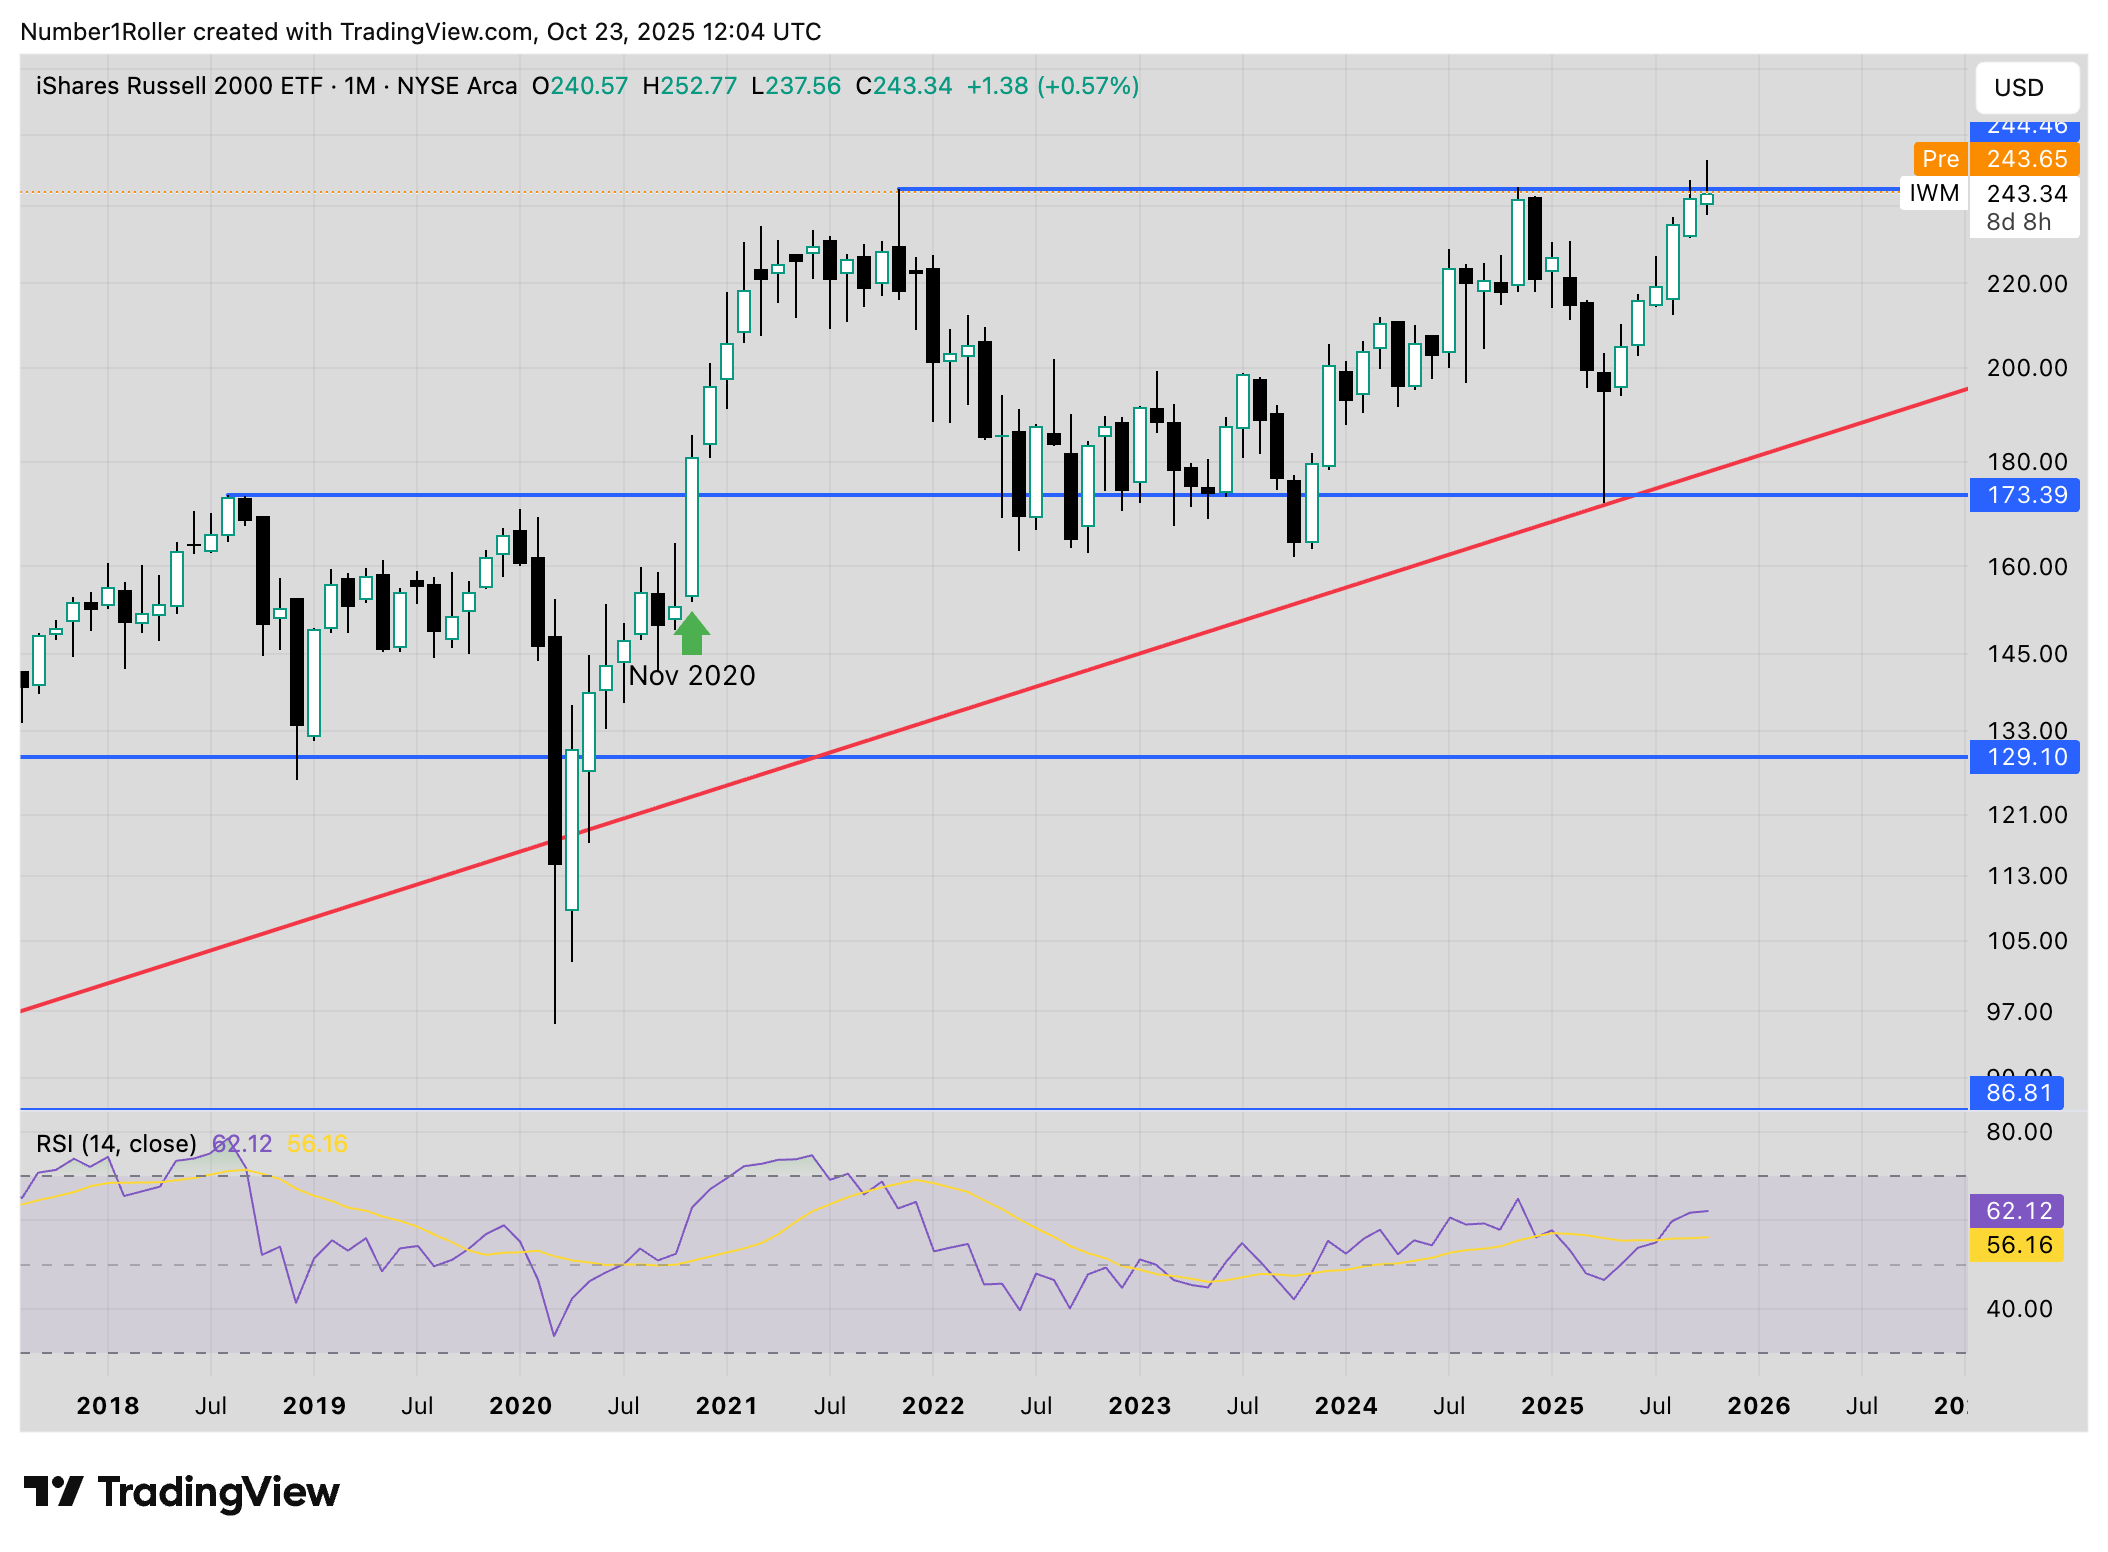
And my final view for this macro setup is IWM. Everyone knows IWM is a sign speculation ramping up. The last time it broke out cleanly on the monthly chart was exactly 5 years ago. Today we have yet to see that clean breakout and close, but if time is any indication we should see it close strongly higher in November.
Wrapping Up
Major market turning points are never easy we have been here calling every one of them this cycle and they always take you to the brink. The market is designed to get rid of the weak minded and low conviction participants right before the biggest moves.
This current market is no exception.
However, with time we can see the market for what it’s truly telling us.
Given the daily, weekly, and monthly cycles on BTC this move appears to be a mirror image of previous shakeouts before major runs.
In 2023 we saw the ETF news come out in November. In 2024 the crypto president was elected in November. Now what will the news be in 2025?
I can’t say for certain but you can bet it will be coming within 10 days or so.
If we just had BTC to look at that would be a strong case in time for a major rally but when we zoom out and pair it with the backdrop in equities, gold, and risk on behavior I can’t see a way this doesn’t have late 2020 written all over it.
This is all coming at the perfect time as the market has been in a stalemate for nearly a year and participants are throwing in the towel left and right. Yet, if they only studied history, if they only looked at the timing of it all, they would see that this time is no different.