Stocks and Crypto Under Pressure as ETF Launches and Election Uncertainty Looms
This week, stocks are pulling back off their record highs, crypto is struggling to perform under a newly released ETH ETF, and the uncertainty around the election continues to intensify.
Is this a cause for concern, or are we simply rhyming with the cycles of the past?
For starters, I want to share with you our post from July 1st to remind you just how powerful this knowledge can be when you get it right.
The image and text above is from our July 1st outlook where the SPX was trading at 5,450. Exactly 200 points later and 17 calendar days it started correcting. Read the full post here to understand how we used date ranges and price ranges to forecast this exact turning point.
If you study hindsight enough it can become foresight. So now let’s look ahead to what this means.
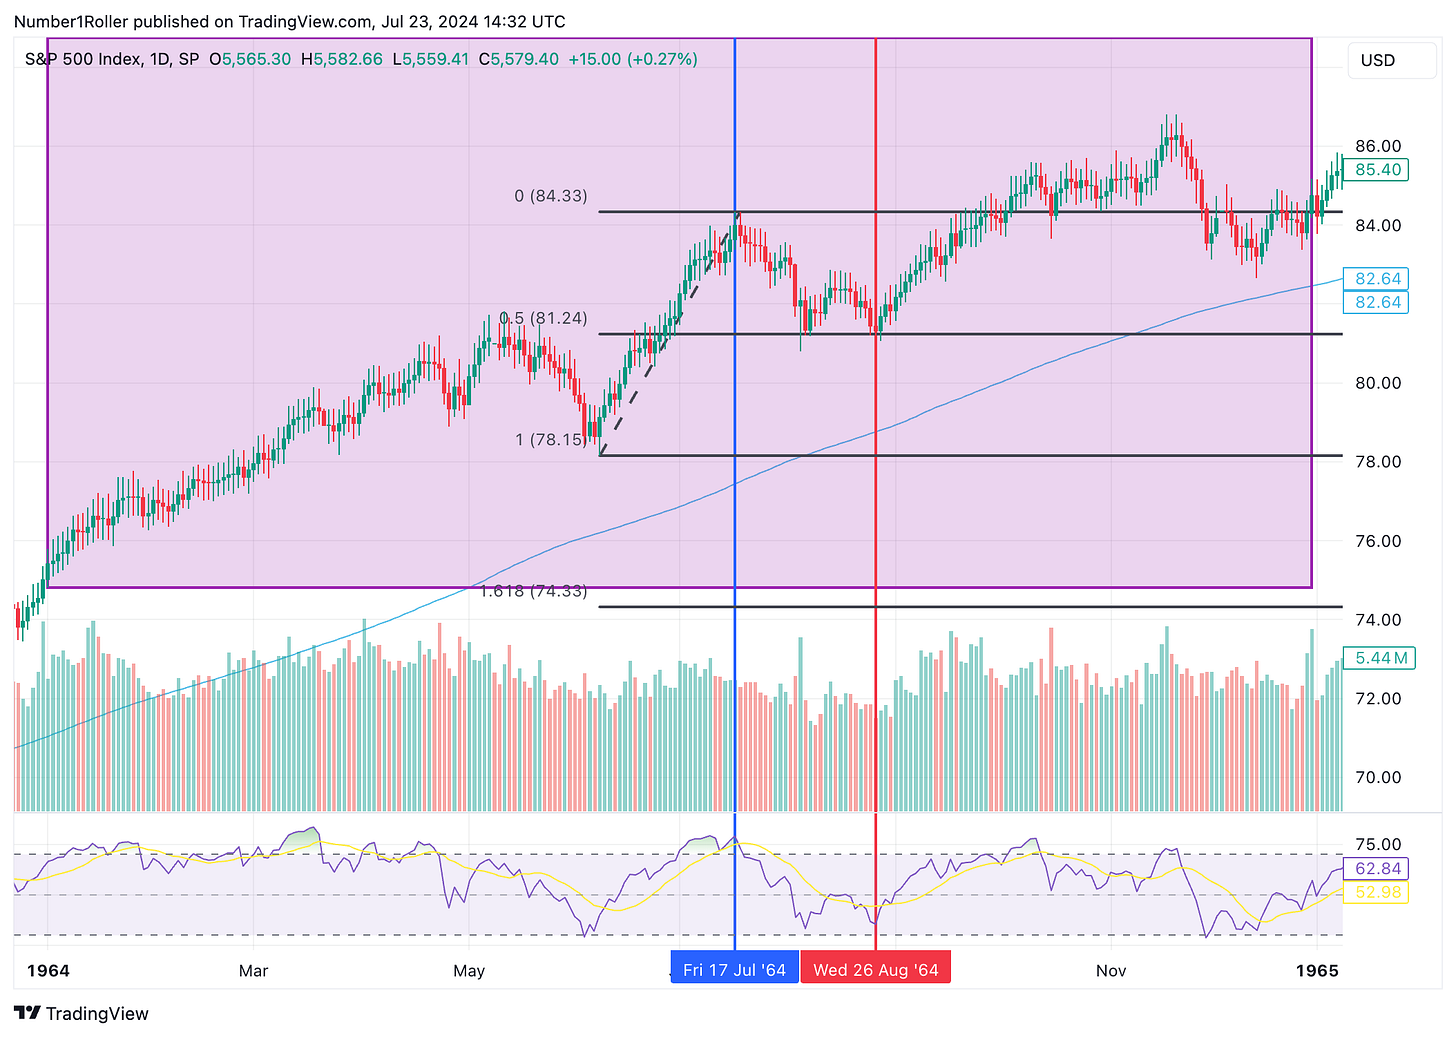
First, looking at the 60 year cycle which Gann called “the great cycle,” we can see how strong of an influence it has had on this year as long time readers know.
In the above image you can see that the 1964 summer top also occurred on July 17th, What followed was a 50% retracement to an August double bottom on the 26th. Then of course continuation of the bull market. Which is exactly where I stand today in our analysis. I am not calling for a major top in any way I was just warning of a dip before a resumption of the trend.
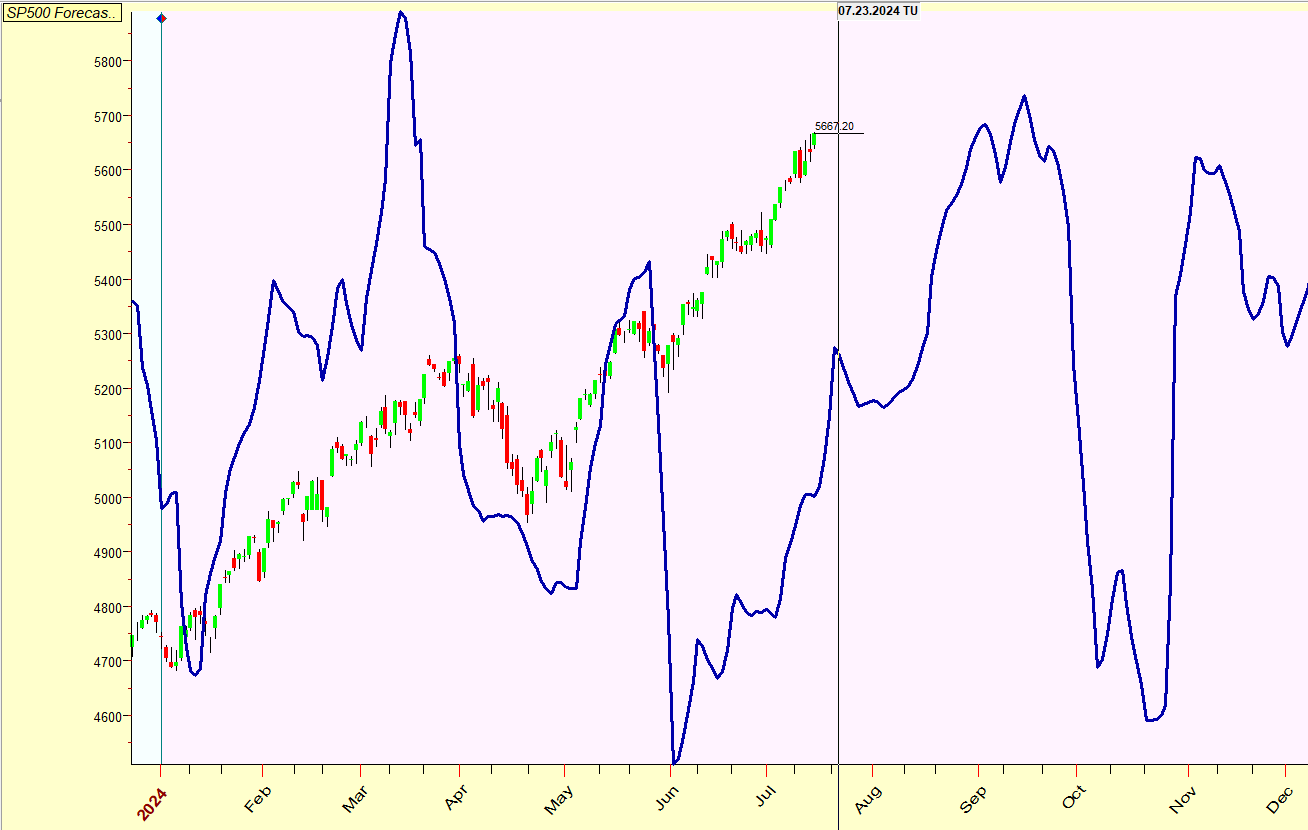
We can also see major lows come about in this early August window in the 20 and 90 year cycles in addition to our SP500 forecast shown belown. This years forecast has been quite accurate and it shows that dip here into August. Remember, this forecast is not about the intensity of the move as you can see, the chart doesn’t match that, but notice, it does show the time roughly of the highs and lows.
Given what we have seen from this market we are always looking for 50% retracements when it comes to corrections. That would mean a price between 5,300 and 5,400 based off the last two lows.
And if stocks are correcting crypto should be in trouble right? Not exactly. I think you know by now about my thoughts on August and the next few weeks so I’m not going to beat a dead horse. But I do want to make an analysis of the little history we have here of BTC vs SPX going into elections.


Here we have the 2020, 2016, and 2012 Bitcoin chart with the SPX price action overlaid in black during the exact same time period. It would help to have more context as they look pretty correlated at first. But on closer look you can see SPX tends to be making lower tops in these images while BTC is making higher bottoms. We then have the point just before the election where the separation begins as the SPX goes to a final low while BTC starts its parabolic ascent usually in October just before the election.
Finally, a few thoughts on the ETH ETF. First of all, I am not fan of the ETF inflows narrative at all. In my view it makes no difference to the cycle one way or the other. This cycle would have happened with or without ETF inflows. The ETFs are simply a way for the big guys to make more money on more fees by spinning up a new narrative under the guise that “this time is different because of ETFs” ultimately to sell their positions to the unassuming retail investor at the end of the day.
That being said, it is certainly my experience that this has opened the floodgates to much more retail buying. Simply by talking to people, I have noticed that the older generation with wealth in their brokerage account, are much more willing and likely to allocate to crypto now because of the fact they can do it through their traditional accounts.
As for the current price action of ETH I am not concerned at all. Everyone in crypto and everyone that launched this ETF has a vested interest in it doing well. The above image is currently the homepage of Ishares website. If you think BlackRock is not pushing its clients to invest in this then you may want to reconsider what you are doing here. Bitcoin ETF saw a two week correction immediately following it’s ETF. A similar timeline would put us at a low right around our major August dates.
Lastly, a quick note for subscribers. Over the weekend we added another token to our Aggressive Alpha watchlist. The six most recent positions we added are up an average of 53% in just two weeks. I believe this one has 10x potential on great liquidity in the next few months with a very similar setup to what we saw with $PEPE.


