
The Market's Next Big Move Is Coming
A major market shift is coming—and the signs are all there for those who know where to look.
I’ve been tracking a critical time window that’s fast approaching, and every major cycle I’ve studied—weekly, daily, and even multi-year—converges on this exact period. This isn’t just another checkpoint; it’s shaping up to be the inflection point that could define the next phase of the market.
We’ve seen this pattern before. In previous cycles, similar setups have triggered massive breakouts or brutal traps, leaving most traders on the wrong side of the move. The key is knowing how price reacts as we enter this window—and I’ve mapped out exactly what to watch for.
From historical seasonality to the repeating 30-week and 210-day cycles, the evidence is clear: this date matters. And with the market still in a three-month range, this moment will force a decision. Breakout, breakdown, or the worst-case scenario—more painful chop.
Most traders won’t recognize what’s happening until it’s too late. But if you’re ahead of the move, you’ll be in position before the rest of the market catches on.
Get the full breakdown—subscribe now to see what’s coming.
Time Ranges and Time Factors For March
Weekly Time by Degrees
Starting with the weekly pressure dates we can see several key weekly inflections all pointing to the first and second week of March.
It will be
30 weeks from the August low
50 weeks from the March top
60 weeks from the BTC ETF
90 weeks from the summer 23’ low
120 weeks from the bottom
All key dates in the market all aligning with that early March window.
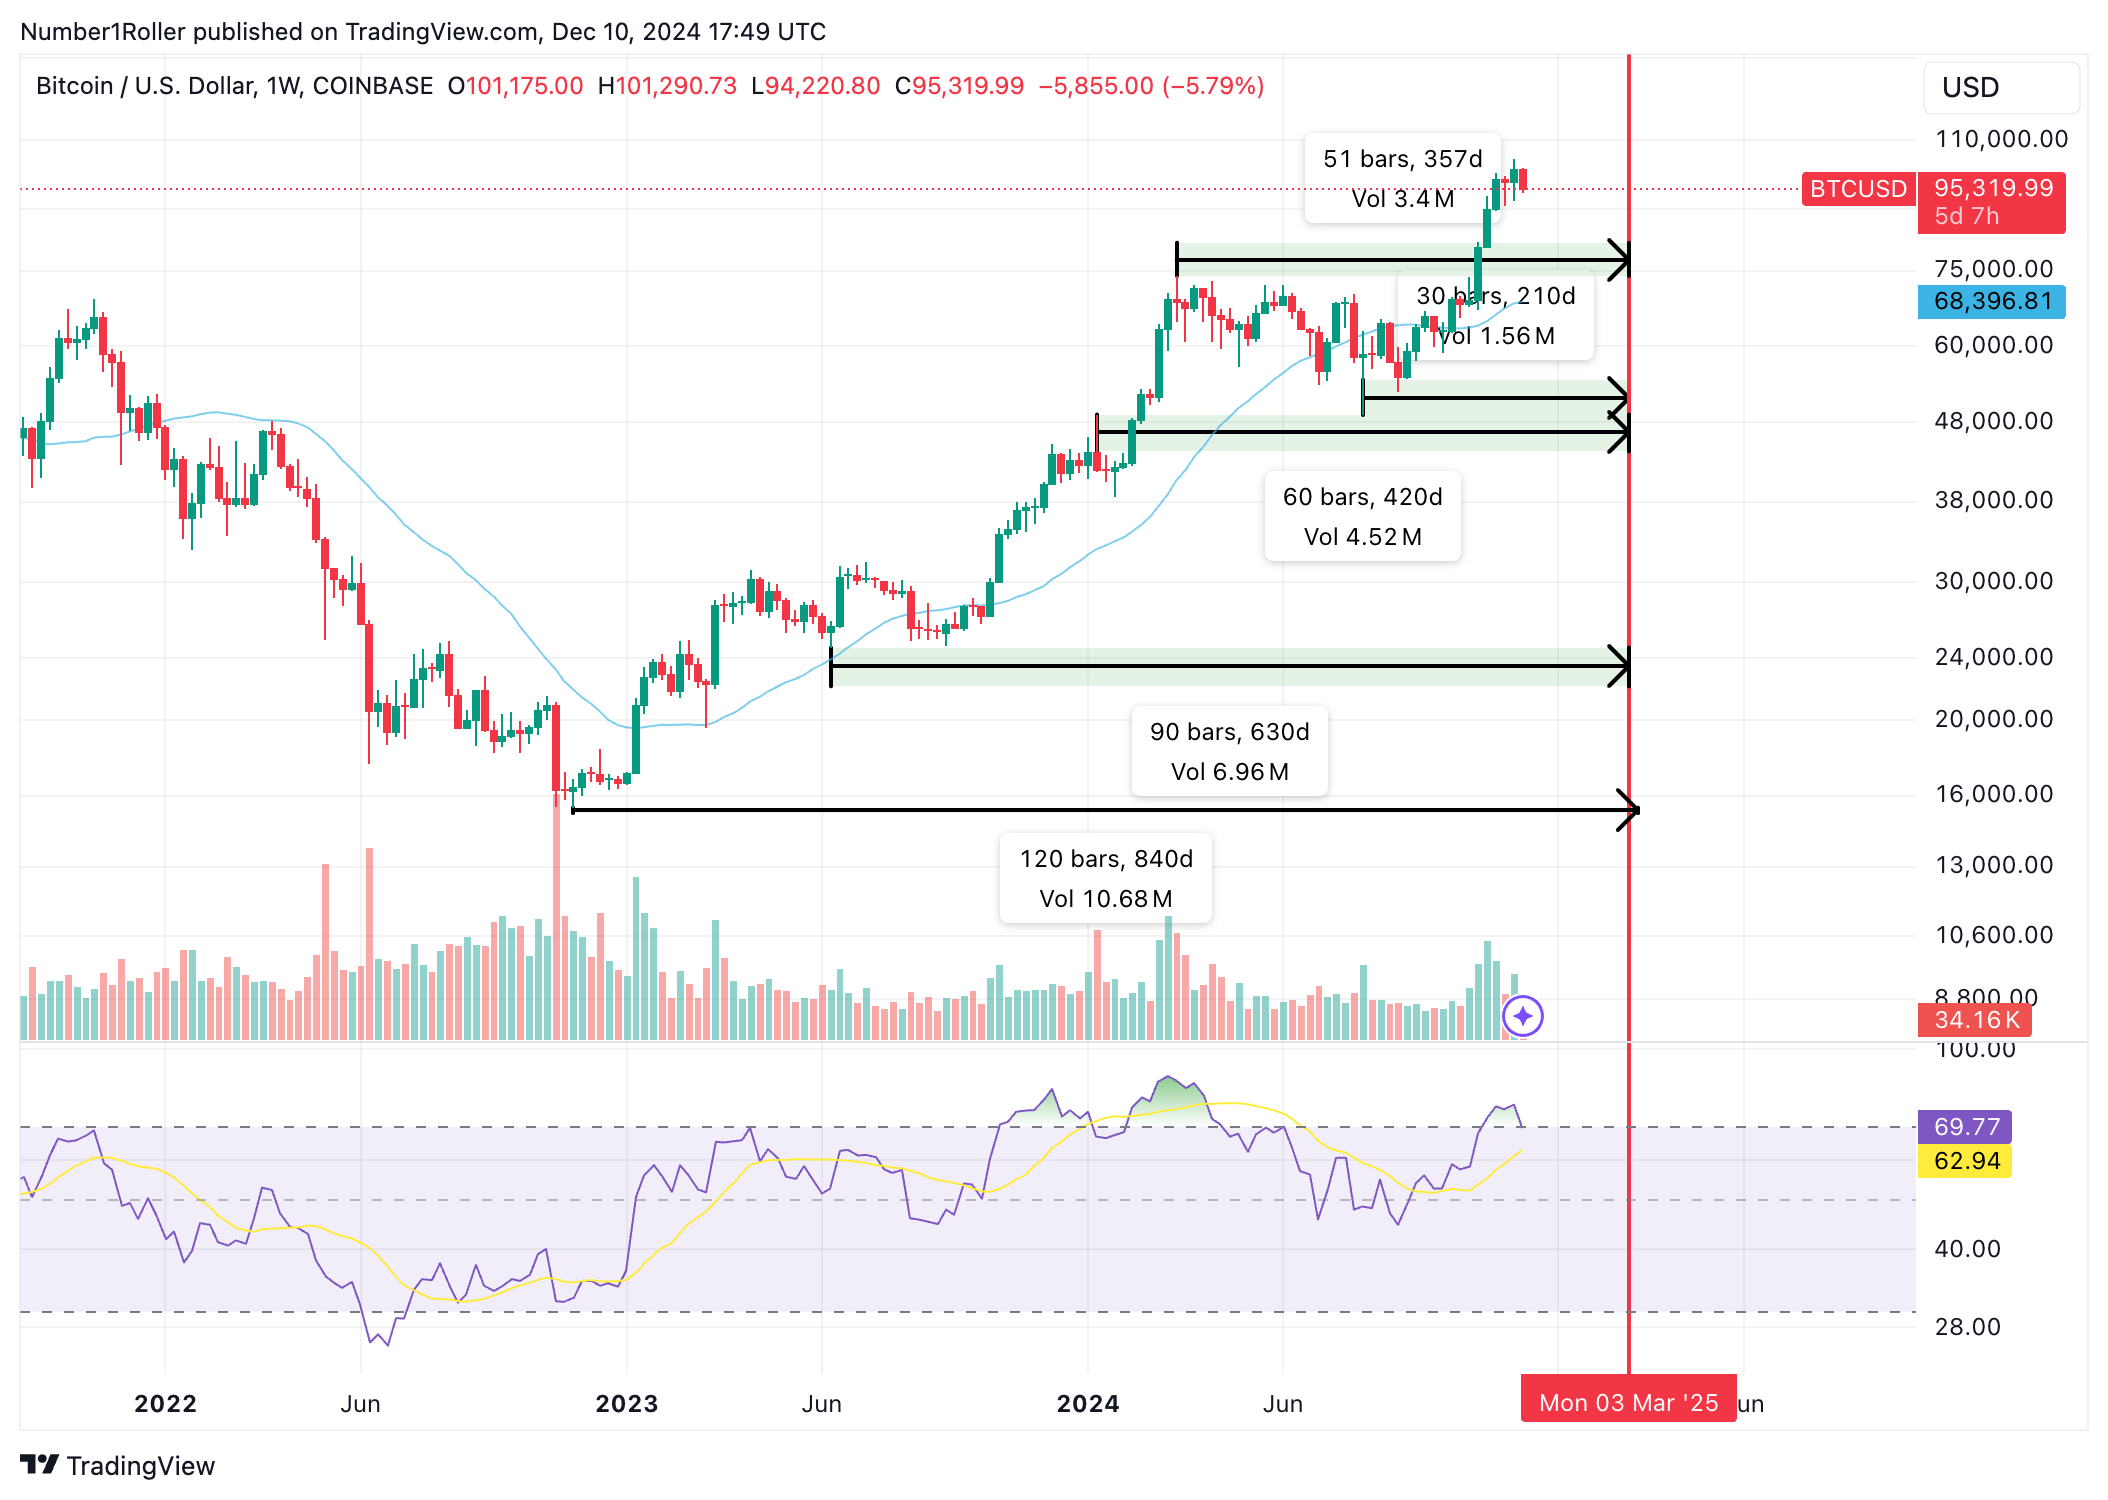
30 Week Cycle Low to High
You can take this from above but I have showed many times how this 30 week low to high cycle has been persisting throughout this market. It’s a very strong and noticeable 210 day cycle that will complete again in that first week of March.

Daily Time By Degrees
Now going down to the daily it’s always important when we see the wheel within the wheel. Or in other words the smaller cycles align with the larger cycles. the more confluence we get the more likely we get a big change in trend.

Above you can see the key daily pressure points going all the way back to December of 2023. There are many of them and the chart is messy but you get the point. Simply count back in increments of 30 and you will see all the key turning points pop up.
210 Day Time Ranges
I talked about the 30 week or 210 day time frames as a key cycle for BTC above. It has held true over many cycles and we have used it throughout this cycle to spot key dates. Here again you can see it a little more clearly on the daily.
210 days from major lows to major highs.

Cycle Seasonality
If we look back at previous cycles we can see a lot of key seasonality and similar time frames measuring from that August low.
In fact in all previous cycles if you measure out 31 weeks from the August low you will see a consistent top at that exact point in time.
2021

2017

2013

2013 is a slight outlier at 33 weeks but not by much. Either way you can see that the key inflection point came 31 weeks from the low made in August no matter which week it was. And, more importantly in all cases it was a weekly top.
Monthly Times
Finally, zooming all the way out to the monthly it’s more of the same. This time you can see the seven month pattern which results in a red month either that month or the following month.

More so if we just look at the current cycle you will see the same 7 month runs playing out over and over.
Seven months up then red month/consolidation. Next month will be 7 months up.

My Thoughts and Conclusion
This March date will be a big one. It’s one I have highlighted as important since our annual outlook came out.
There are a lot of important factors at play here given we have been in a range for over 3 months now. Depending on which way price trades into this date which will officially be March 3rd, will determine how we play it.

The way I see it the market has to close above or below one of these black line levels to confirm anything.
That makes the top end 106,149 and the low end 92,542.
A couple scenarios to consider:
the market trades up into this time frame as I have been suggesting but makes a slightly higher high or a triple top. In this case I would certainly be taking profits into this window if we are not able to make a decisive breakout and new ATH. I believe that would be the perfect fuel to suck more people into the market just in time for another drop. Remember sentiment can change very quickly and a two week rally from now would bring out the risk in short order only for it to be another quick run that gets shut down.
The other scenario is that we trade lower into this time frame and possibly even see a flash dip on BTC before marking a final low and then what would be a big run into May.
The final scenario is possibly the most frightening and that is that the market doesn’t make a decisive move either way and just continues bouncing in the range until as long as late March where we have our next window.
I certainly think this will be an inflection point no matter how price trades. The good and bad news is that this is still very similar to 2017 price action.

If you look at the chart above you will see that in 2017 the market did not decisively take out the January high until February 23rd. It then only ran up for a few days to March 3rd before falling back for a three red week reversal.
So I’m on high alert for something very similar to play out here. The market breaks out, all of a sudden everyone thinks it’s game on, only for it to last a few short days before falling back until the end of March. It would be a very nasty scenario indeed and one that would trap a lot of people.
It’s the ultimate frustration cycle where alts continue to have only a few weeks of oxygen before getting stamped out. The good news is it would still be just in time for the month of February to close green and negate a more bearish scenario but it would still mean more pain until the end of March.