
The More Things Change the More They Stay the Same
What time is telling us about the current crypto cycle and what it means for 2025
This week we have some big time factors coming into play.
I have some great charts to show you that will tell you a lot about a market and how it moves in time.
These are simple yet powerful Gann principles that we have been using to time this market throughout the cycle.
These charts will show you why the more the cycle changes, the more it stays the same. Past cycles are great to draw comparisons from but no two cycles are ever the same.
Finally, I am going to show you why the December window may have given us clues into the timing of 2025 cycle and what it will mean for inflection points going forward.
All of this is coming right into the end of the year and making for an exciting start to 2025.
Gann Rules
Our seasonal Gann rules are still in effect this week.
The holiday weeks have been slow but I expect that to change soon with the advent of a new year. We have a big confluence of dates coming up on both high and low time frames.
BTC and ETH did in fact make a low right on the 22nd or at least a day or two on either side. That would put in effect the rule for a January rise.
The time factors and time ranges we are going to look at suggest that January should favor the bulls.
BTC Time Factors
This week is showing confluence with several major weekly inflection points over the last 4 years.
Starting with the 2021 summer low 180 weeks back, the same time factor then gave us an important high 90 weeks ago, followed by another important weekly swing high just 30 weeks ago.
So we have confluence of the 30, 90, 180 degree cycles which have all given us key weekly turning points.

BTC Time By Degrees Dates
The weekly cycle above also coincides with our current time count with every 30 days from the 4/5th of the month giving us an inflection point.
This daily time by degrees you can track all the way back to the beginning of the year.
Up until the most recent December 5th date this cycle had been calling out nearly every major and minor turning point to the day.
The fact that December 5th did not bring up a low or the quarterly high suggests to me that this cycle may be starting to deviate a bit. But I’ll cover more on that later.

Balancing of Time
This is the most important chart I will show you this week.
We always talk about balancing of time or time overbalancing of time.
That simply means if the market is running up longer than it runs down it’s a bull trend and a bull market.
If the market is making longer runs down that it is up, it’s a bear market.
So in theory, we want to see this market run up longer than it did in the previous run or at least equal to it.
That would tell us that the bull market is strong.
If you look at the chart below you will see how this market is perfectly balancing itself in time.

The red box shows the two summer ranges of 2023 and 2024 from their highs to the low point. Notice the both came in around exactly 22 weeks
The green box then show the time from the low point to the first significant pull back. Notice they both came in around exactly 17 to 18 weeks from the low.
However, if we take both full cycles from the high to high you will see that they both perfectly balance at 39 weeks.
22 + 17 = 39
21 + 18 = 39
We can see the same thing if we look at ETH. We have two equal periods balancing, the consolidation phase, and the run up to the first correction.

This is whats known as the balancing of time and it means this market is perfectly healthy. It would suggest that this coming week is critical.
If we are in fact still in this same cycle, which we have to assume, then we should expect a final low any day. If we were to continue into a further decline for another week or two we would have to take that as an early warning that time is now favoring the bears.
This is one way that we called the chop from this past summer so well.
We knew that the market was running out of time to resume trend. The cycle was still in tact but many were calling for a new low in October.
We knew that because of this rule, the market simply could not make a new low after August and be in a bull trend.
That is similar to what we are seeing here. I believe that the run from September to March of last year is once again calling out this run and telling us what will happen from a timing perspective.
That means we should see a low here around our early January time window and a big move up to follow.
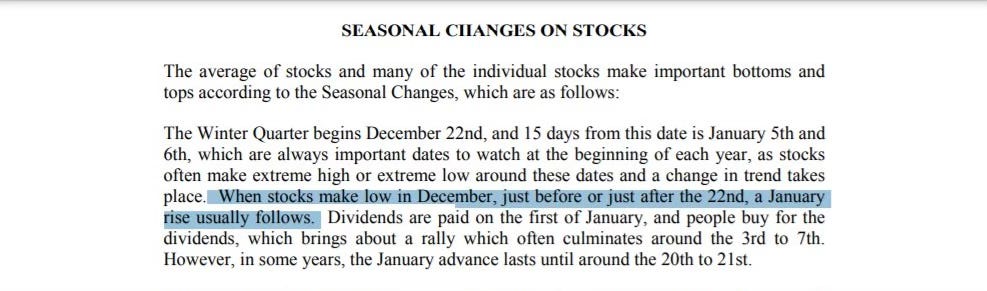
ETH Relative Strength
In addition to this evidence we are starting to see the relative strength of ETH come into a strong seasonal pattern. I know it may seem like this is taking a lifetime but thats because it is.
Big macro trends like this take time to play out and they don’t turn around on a dime.
That said you can see how in previous cycles ETH/BTC likes to make that final low in late December just before the final year of the cycle.
At the same time we are seeing Gann rules work here just as well. ETH bottomed right on the 22nd and has held the important 50% level from the run up in addition to the balancing of time I showed you above.

The way the market currently sits BTC has made new low closes on the daily as where ETH has not. So we are seeing the same shift in price action from BTC to ETH at roughly this same time in each cycle just like we should expect.
However, because it doesn’t happen overnight most people get frustrated and miss the forrest for the trees.
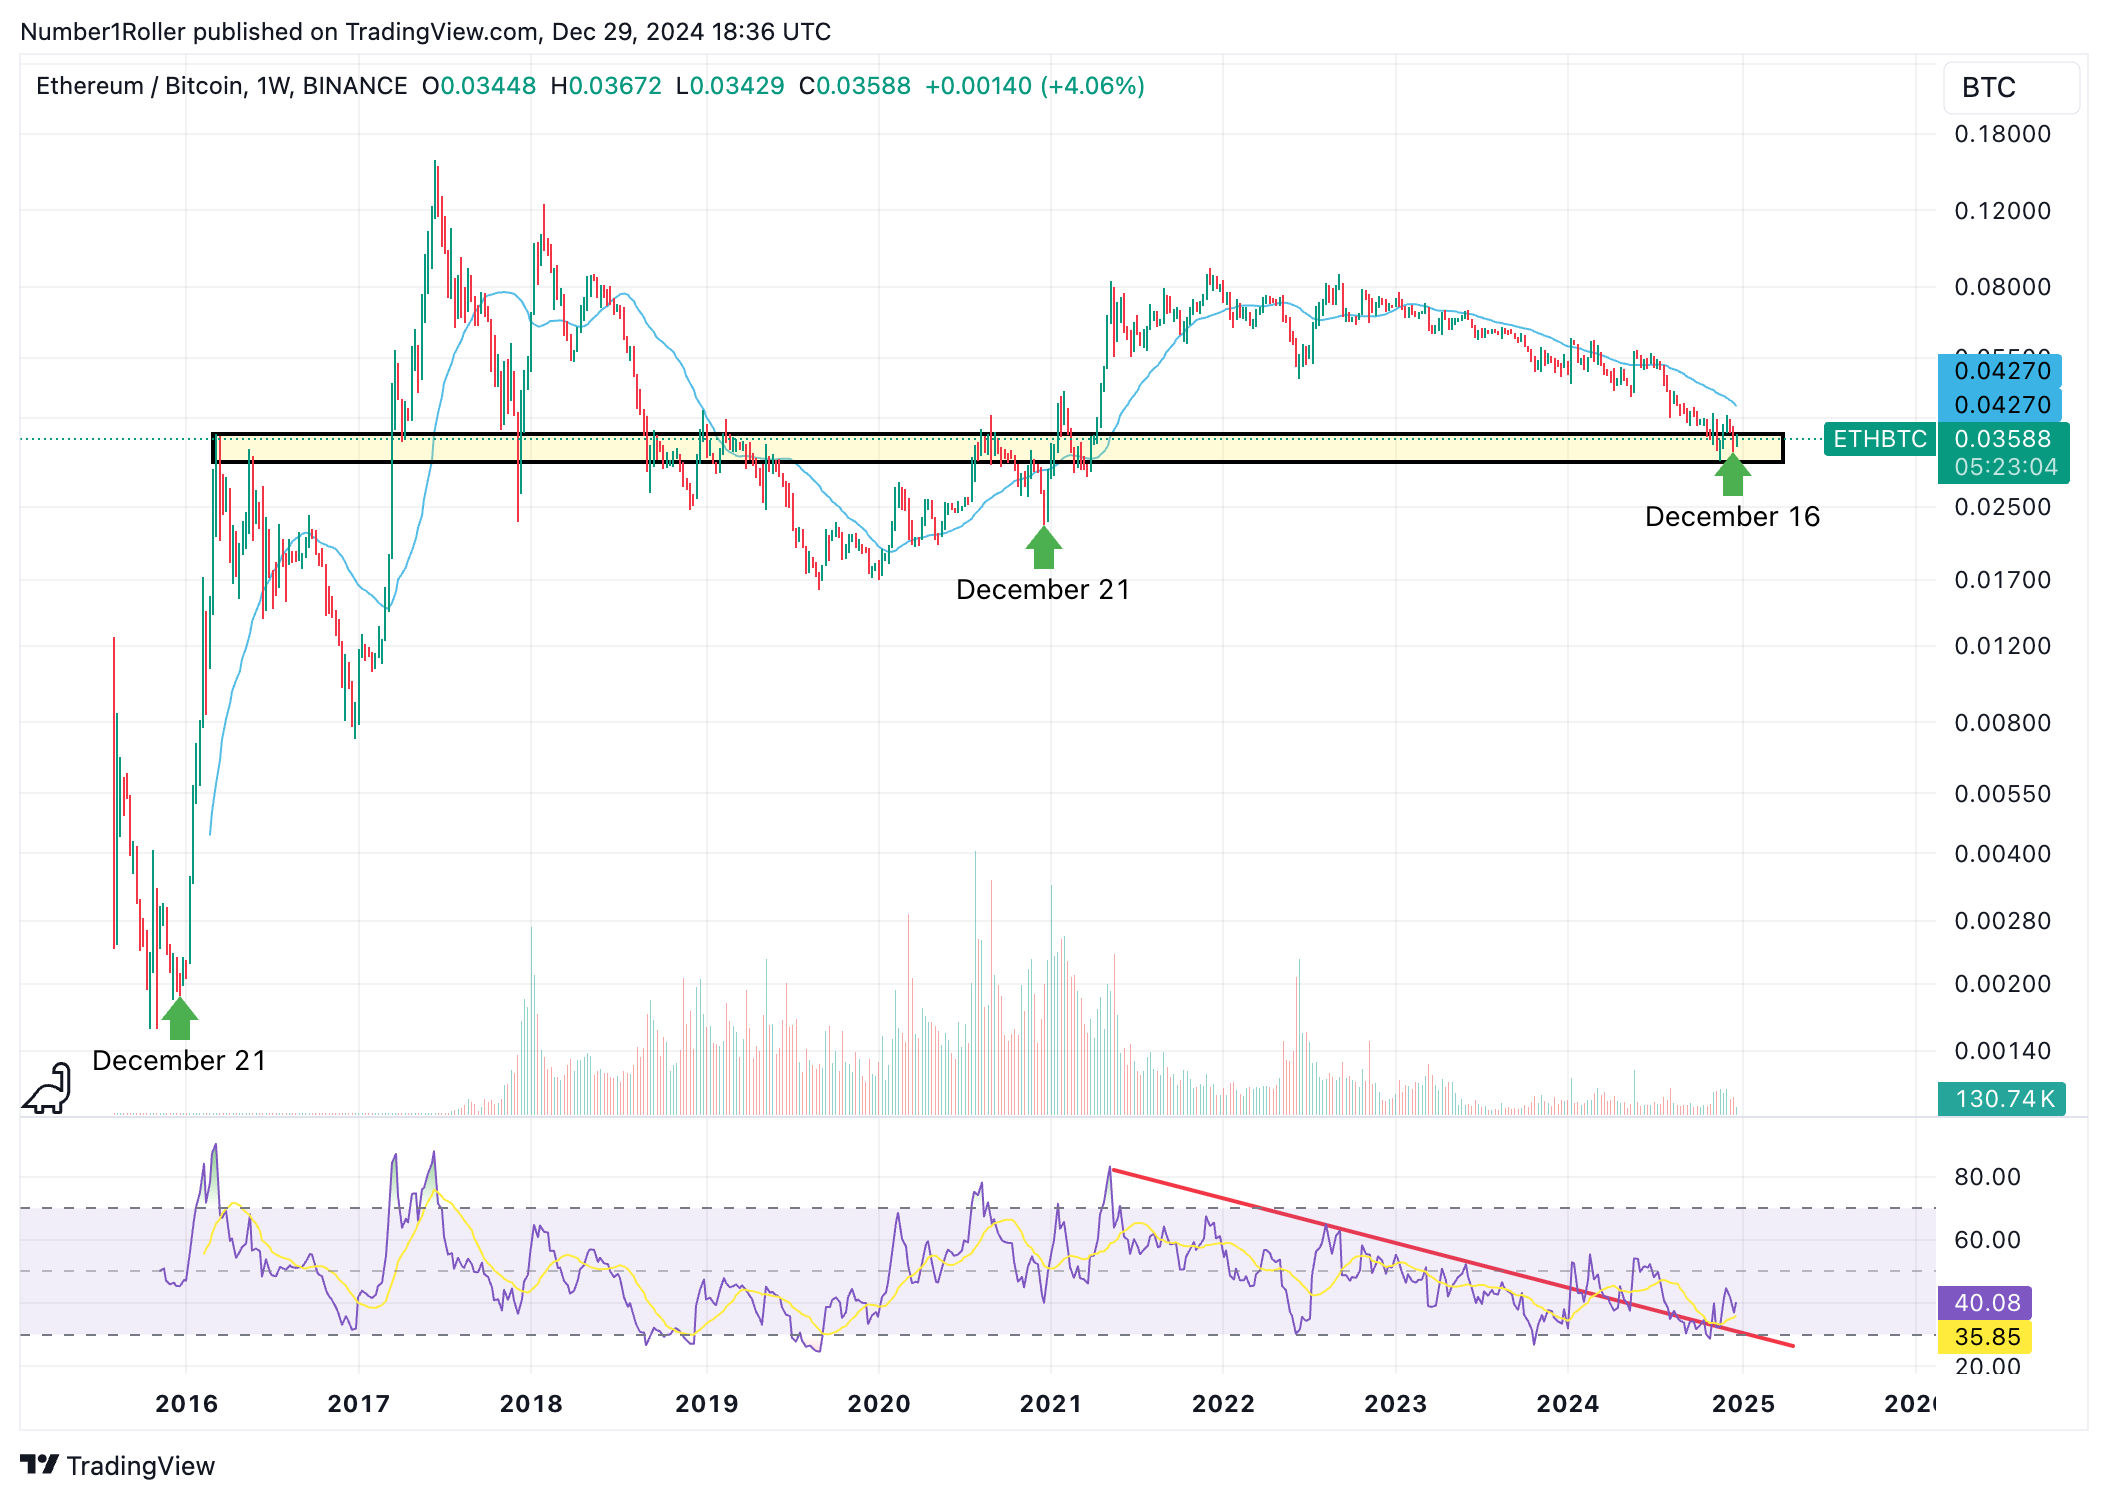
ALT Market
It’s the same thing in the low cap space. Look how the current cycle continues to call out the time ranges for you. 36 weeks of consolidation and then new high in OTHERS.
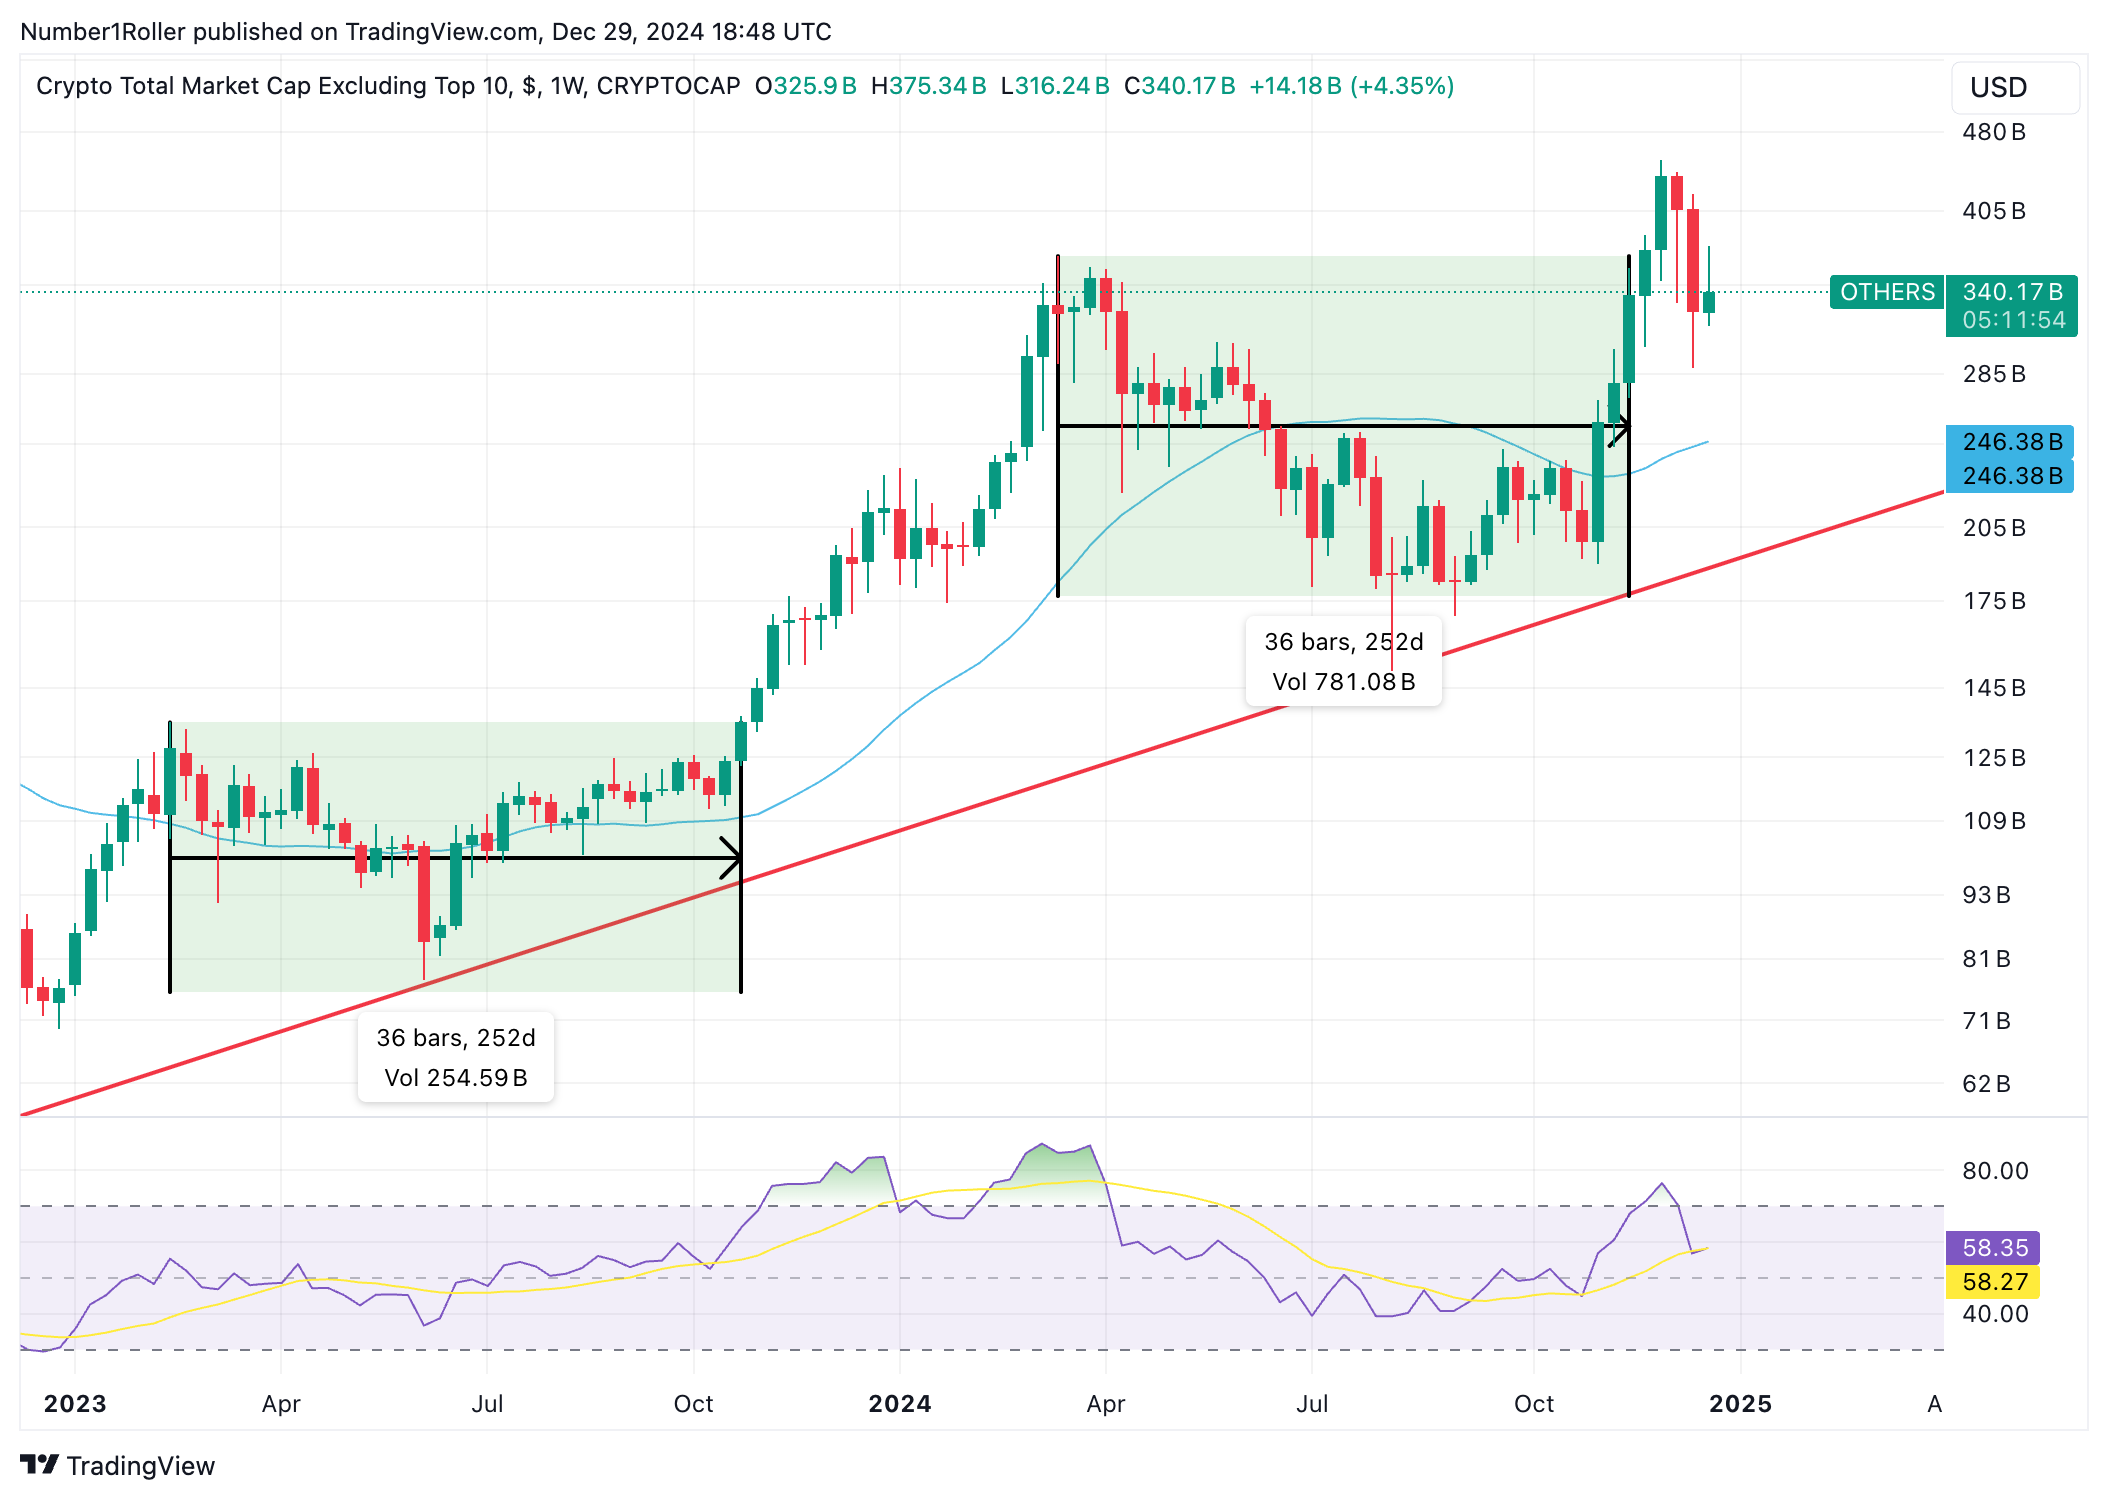
Additionally, once the bottom was in the chart ran up 17 weeks and made a two week pull back. That’s exactly what we’re seeing here again.
Conclusion
The more things seem to change the more they stay the same.
No two cycles will ever be the same. This cycle has shades of 2017 and 2021 but this cycle is calling itself out and what it’s going to do.
With my new view around the balancing of time in this cycle I am starting to lean much more bullish here. We know alts and micro caps are down 70-90% which is the typical sweet spot for a correction.
We also saw a change in the way the market reacted to the December time factor that has been working so well this cycle. Instead we made a high in the middle of the month which is certainly a sign of a potentially changing market.
That said with so many time confluences coming together here in our January 2-4 window I would have to anticipate a low in this market. The way this cycle has tricked many people is due to the price action but we proved today that time continues to be the strongest factor.
The balancing of time we are seeing tells me that this cycle is right on track and healthy. It may not be exactly like 2017 or 2021 but it’s telling us the nature of itself through these time ranges.
That leads me to believe that we may now be slightly ahead of schedule for where we were in past cycles.
Thinking this time is different is the most dangerous phrase in investing. We have to assume this time is the same although the cycle itself may be slightly changing the time shows us that it’s staying the same.
Which means we should favor the probability of a big run staring around here and not a huge decline. Although we could get one more week that doesn’t look good, I anticipate that mid January window will be important and possibly favor a high.
The thing to do here is sit tight if you’re down I expect a bigger recovery to start very soon. If you have been waiting to deploy capital I would start buying alts and memes that have run their 70-90% corrections. The risk to reward is favorable here.
Finally, look to consolidate and add to stronger tokens and narratives like the Base AI plays I shared last week. Historically the tokens that perform the best over the next quarter are the ones that have been hot at the end of the year.
I will keep you updated on that as we will likely be adding some to our portfolio in the coming days.