
The Stars Are Aligning: Key Financial Signals Indicate a Massive Crypto Bull Run
Last week we talked about why Bitcoin and the rest of the crypto market are on the verge of a historic bull run. This week I want to highlight some other key signals that are flashing and giving us the green light for the cycle to roll on.
For starters, there were a few financial news stories in particular that caught my attention as they popped up on my feed this morning.

Goldman announced that they doubled their profits in the second quarter mostly due to dealmaking coming back on Wall Street. We know because of the 18.6 year real estate cycle that this is the type of headline we would expect to see at this stage of the game. Big banks making huge profits is key but even more-so it’s how they did it…dealmaking. Dealmaking means that appetite for risk is increasing and better yet it means they need to underwrite these deals with debt.
Speaking of dealmaking, the other story that caught my eye was Google in talks for what would be a record acquisition of $23 billion dollars. Not something you would see in a bad market.
So we have big banks and big tech breaking out the checkbooks and making deals right on cue with when we should expect it.
This type of risk on behavior and debt creation is showing up directly in the stock market. Last week we saw a divergence we have not seen in some time between IWM (Russel 2000 small caps) and SMH (semiconductors). IWM shot up almost 5% while SMH struggled to tread water and closed down. The DOW also broke out to a new high after struggling the last few weeks in the face of the SPY and QQQ rally. The DOW may not be a risk on signal but it is a sign that the market breadth is picking up since it’s not comprised of big tech companies.

These are signals of rotation into a riskier environment as the stocks that have been lagging are going to start playing catch up. You can see that in the stock price breadth indicator. For all of 2024 there has been almost no breadth to this rally. But with the big swing last week and the extreme fear on this indicator it looks like that is about to change and this will start moving higher.
Historically, this all aligns exactly with our current BTC price action.

The green arrows on this weekly BTC chart are the exact points in these respective cycles where the IWM broke out. In each cycle this has been a key indicator for a big rotation into risk.
However, it won’t happen overnight. BTC snapped its 4 week losing streak as we highlighted in last week’s outlook but I would not be surprised if it continues a slow grind up for several more weeks. Historically, we are entering a very very bullish period but in past cycles the momentum really begins in the second half of the third quarter. Meaning late August or September. Here we are still in the first few weeks of the quarter so be patient.
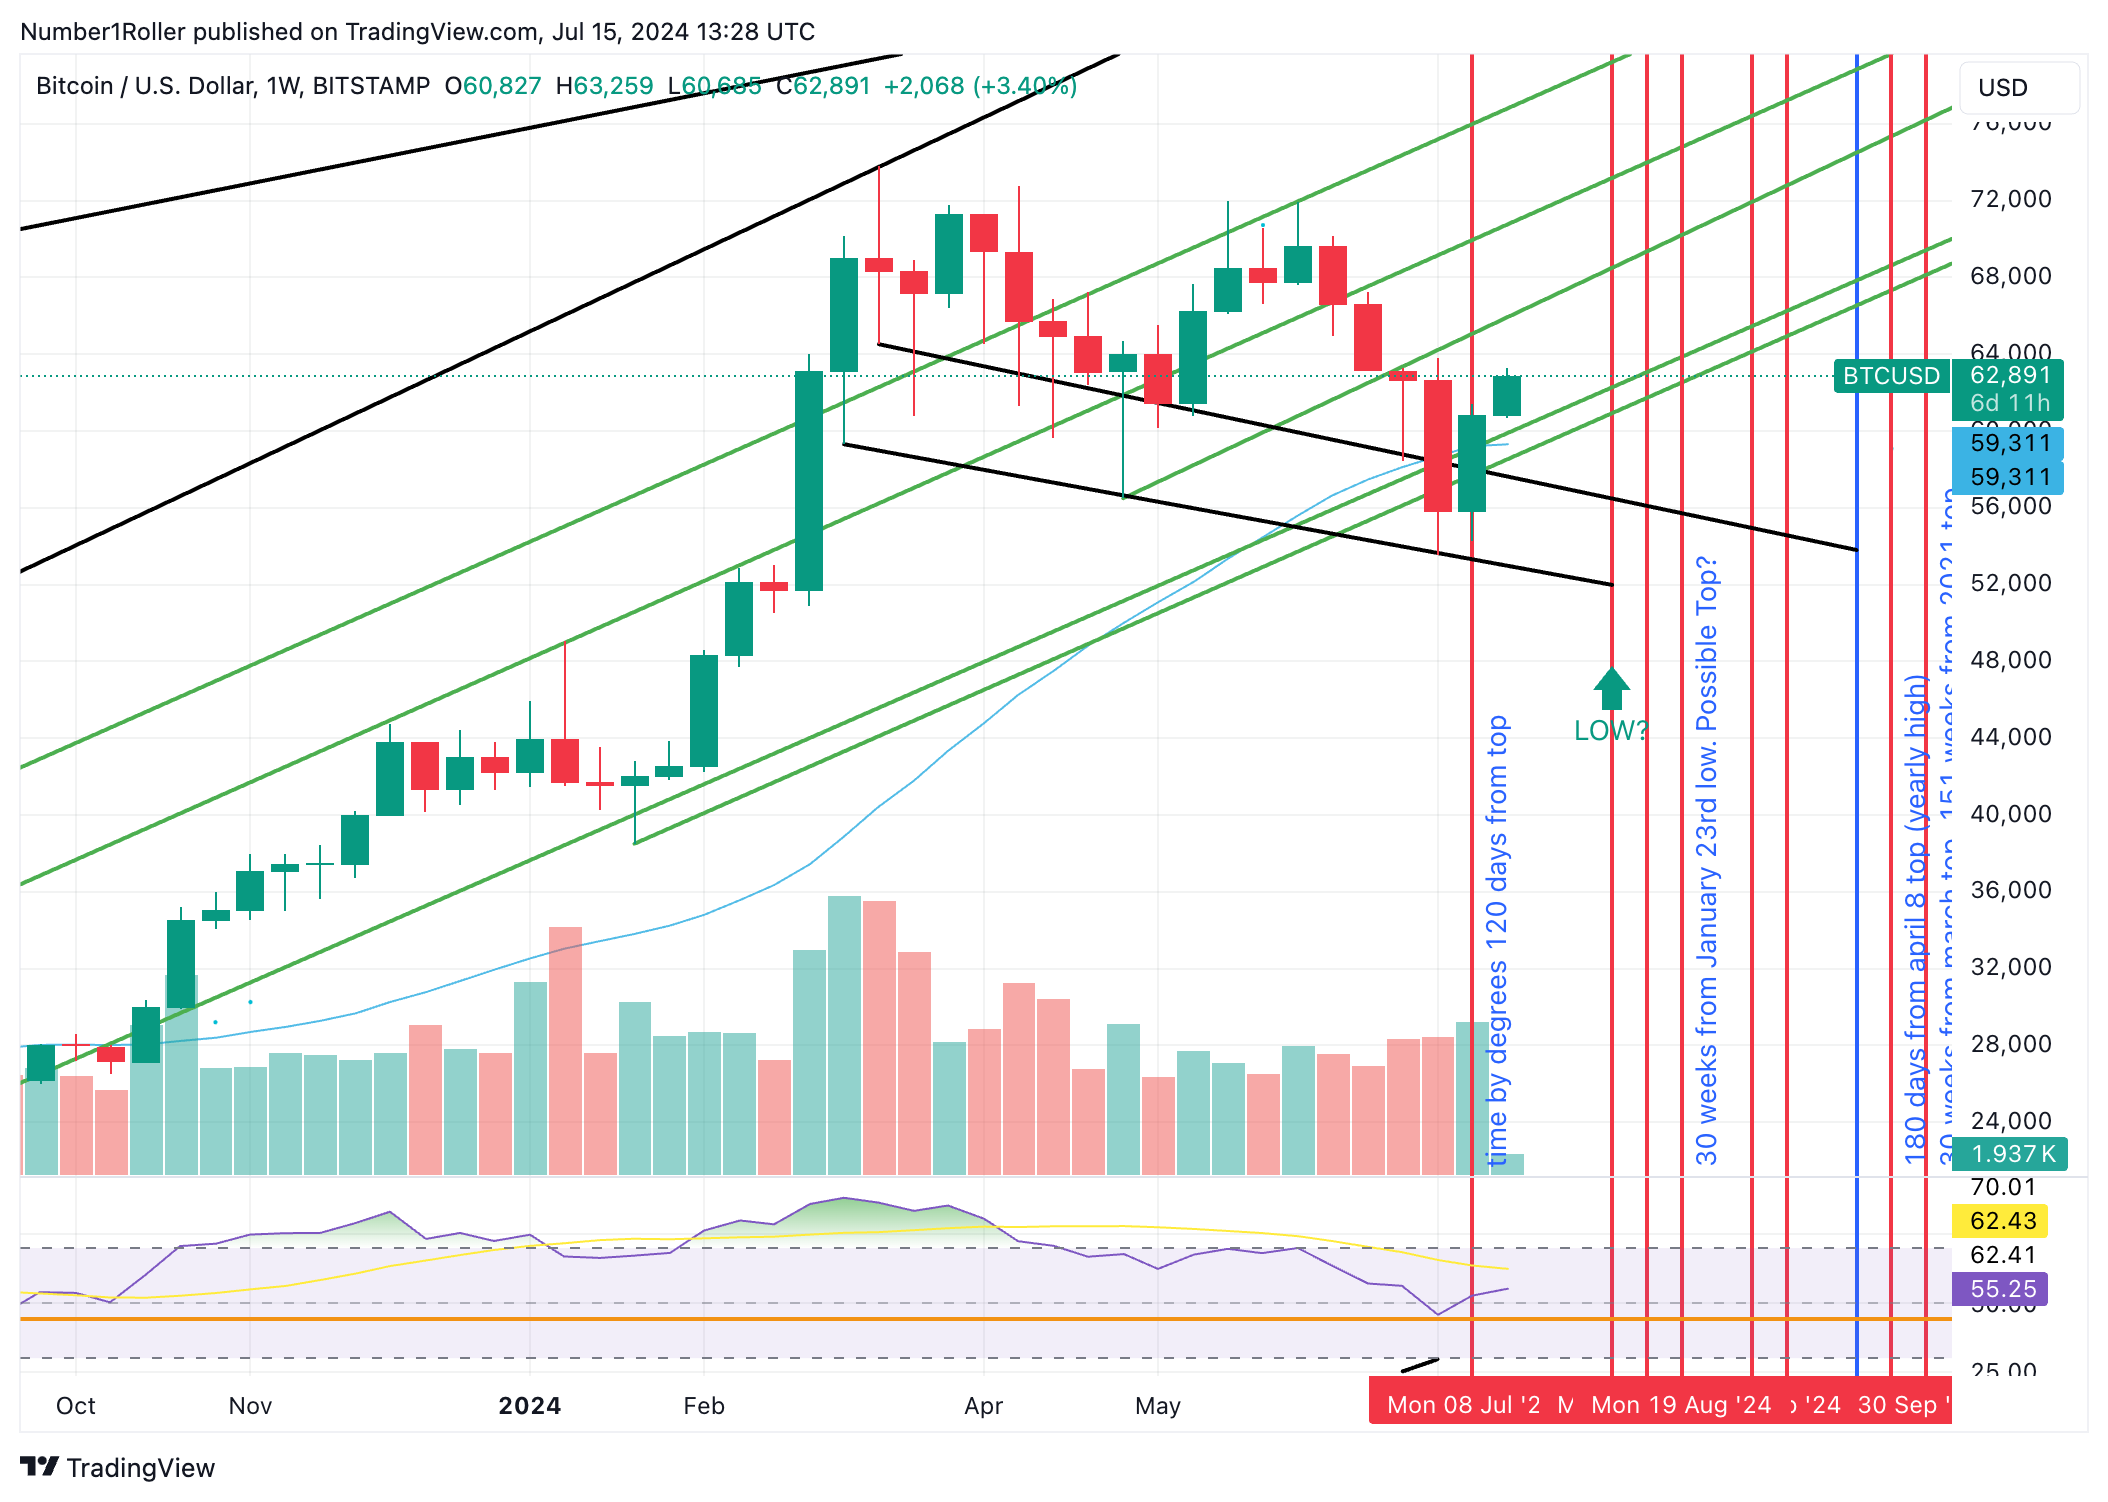
BTC was able to post a nice recovery on the weekly chart but be aware of that early August window we have been highlighting. This stage of the cycle is notorious for flash dips that can be quite nasty so be warned over the next few weeks. As shown on the chart below indicated by the red arrows, each flash dip in August of the election cycle can be ugly but at the same time very short lived and never more than one week.

Continue accumulating the strongest projects here and be ready for a “one more dip” scenario if we get it. If not, thats fine too. Simply hold and stay patient I firmly believe the best is yet to come and every day of patience will be worth the wait.