
Trump's Meme Coin Frenzy Ignites The Market
Before we get into today’s outlook I want to let the free subscribers know that they can now access our annual forecast separately at the link below
In Friday’s video, I discussed how animal spirits were entering the market. Right on cue, by Friday night, Trump launched his official meme coin, sparking a weekend frenzy of takes on how this might impact the crypto market.
For those who understand the current cycle and the magnitude of this moment for altcoins, this development comes as no surprise—it’s perfectly timed. Trump is positioning himself as a president openly giving the green light to speculate at the highest levels in crypto. While we know how this mania will eventually end, history is once again rhyming, and the cycle is pushing forward into its next phase.
The momentum is clear: SOL, this cycle’s leader, just hit new all-time highs, signaling that the altcoin run is only getting started. Gann always emphasized watching market leaders closely, as they reveal the next move—and SOL is showing us where this is headed.
Meanwhile, the hype around Trump’s meme coin on SOL has reignited hate in Ethereum, which just hit a new cycle low against Bitcoin. Since most of our portfolios are focused on this space, it’s only right to do a full cycle analysis of Ethereum today. Historically, ETH has been pivotal in past alt seasons—much like DOGE in its role as a cycle catalyst—making it essential for a full-blown rally.
That said, we must respect what time and price are telling us. Trump’s move to build a legitimate DeFi project on ETH while launching his memecoin on SOL perfectly sums up the disparity between ETH and SOL price. SOL continues to lead speculative action, while ETH grinds forward as “programmable money.”
Finally, with XRP and the 2017 cycle narrative resurfacing, February is shaping up to be a pivotal month for ETH. Let’s dive into how Ethereum is following the trend, albeit at a slower pace, and why its role in the market remains critical.
90 week cycles and midpoint

The 30, 60, 90 and 120 week cycles continue to prove themselves.
Above we have the 90 week cycle from the low of 2022 to the high of 2024 perfectly timed.
The key about the 90 week cycle is that you likely see major inflections around the midpoint at 45 weeks.
You can see that is exactly what happened in the first 90 week cycle.
The current 90 week cycle is set to complete around November 24th with the exact midpoint falling on the low of last weeks wick.
Being 45 weeks into a 90 week cycle means this should be our weekly inflection point.
As for the end of it falling on late November we should mark that date as a date to watch for a top. But more on that later
Current Strength and Accumulation

Currently, the way I see this ETH cycle is that it has had two big moves and two big accumulations similar to what BTC did before its more recent breakout.
As the above chart shows the first move off of the 2022 bottom was to the .25% level. There it was met with major resistance and a long period of accumulation below that level.
We then had the breakout from there and moved up to test the .75% resistance area which sits just at 4,000 and has been a major level to beat ever since.
However, notice how similar this long accumulation period has been to the previous one as shown below in the fractal.

This fractal is from the red box which was that first long consolidation. It’s been nearly a repeat of that price action before the big move up.
You will see some differences in the timing of it but I believe that is okay due to the position of the market.
As where before the market was still weak under the .50% level in accumulation it has now flipped that to a position of strength in its macro accumulation.

Not only has it regained and, so far, held the 50% level but it also has regained its position above the wedge pattern.
So yes, if we are considering the timing of the range it’s a bit off and suggesting a long drag lower after another brief pop to 5000.
However, given the similarities in the price pattern in confluence with the time of the cycle the seasonality and strength are favoring a bullish move from this inflection point rather than a bearish move.
February Breakouts


Continuing with the seasonality of ETH from past cycles we can see that the month of February has historically been the month where it makes a new all time high.
In 2021 we saw it happen in the first week.
In 2017 we saw it happen in the last week.
Which, again is one of the main reasons I have been preaching patience until mid February window.
Time Ranges
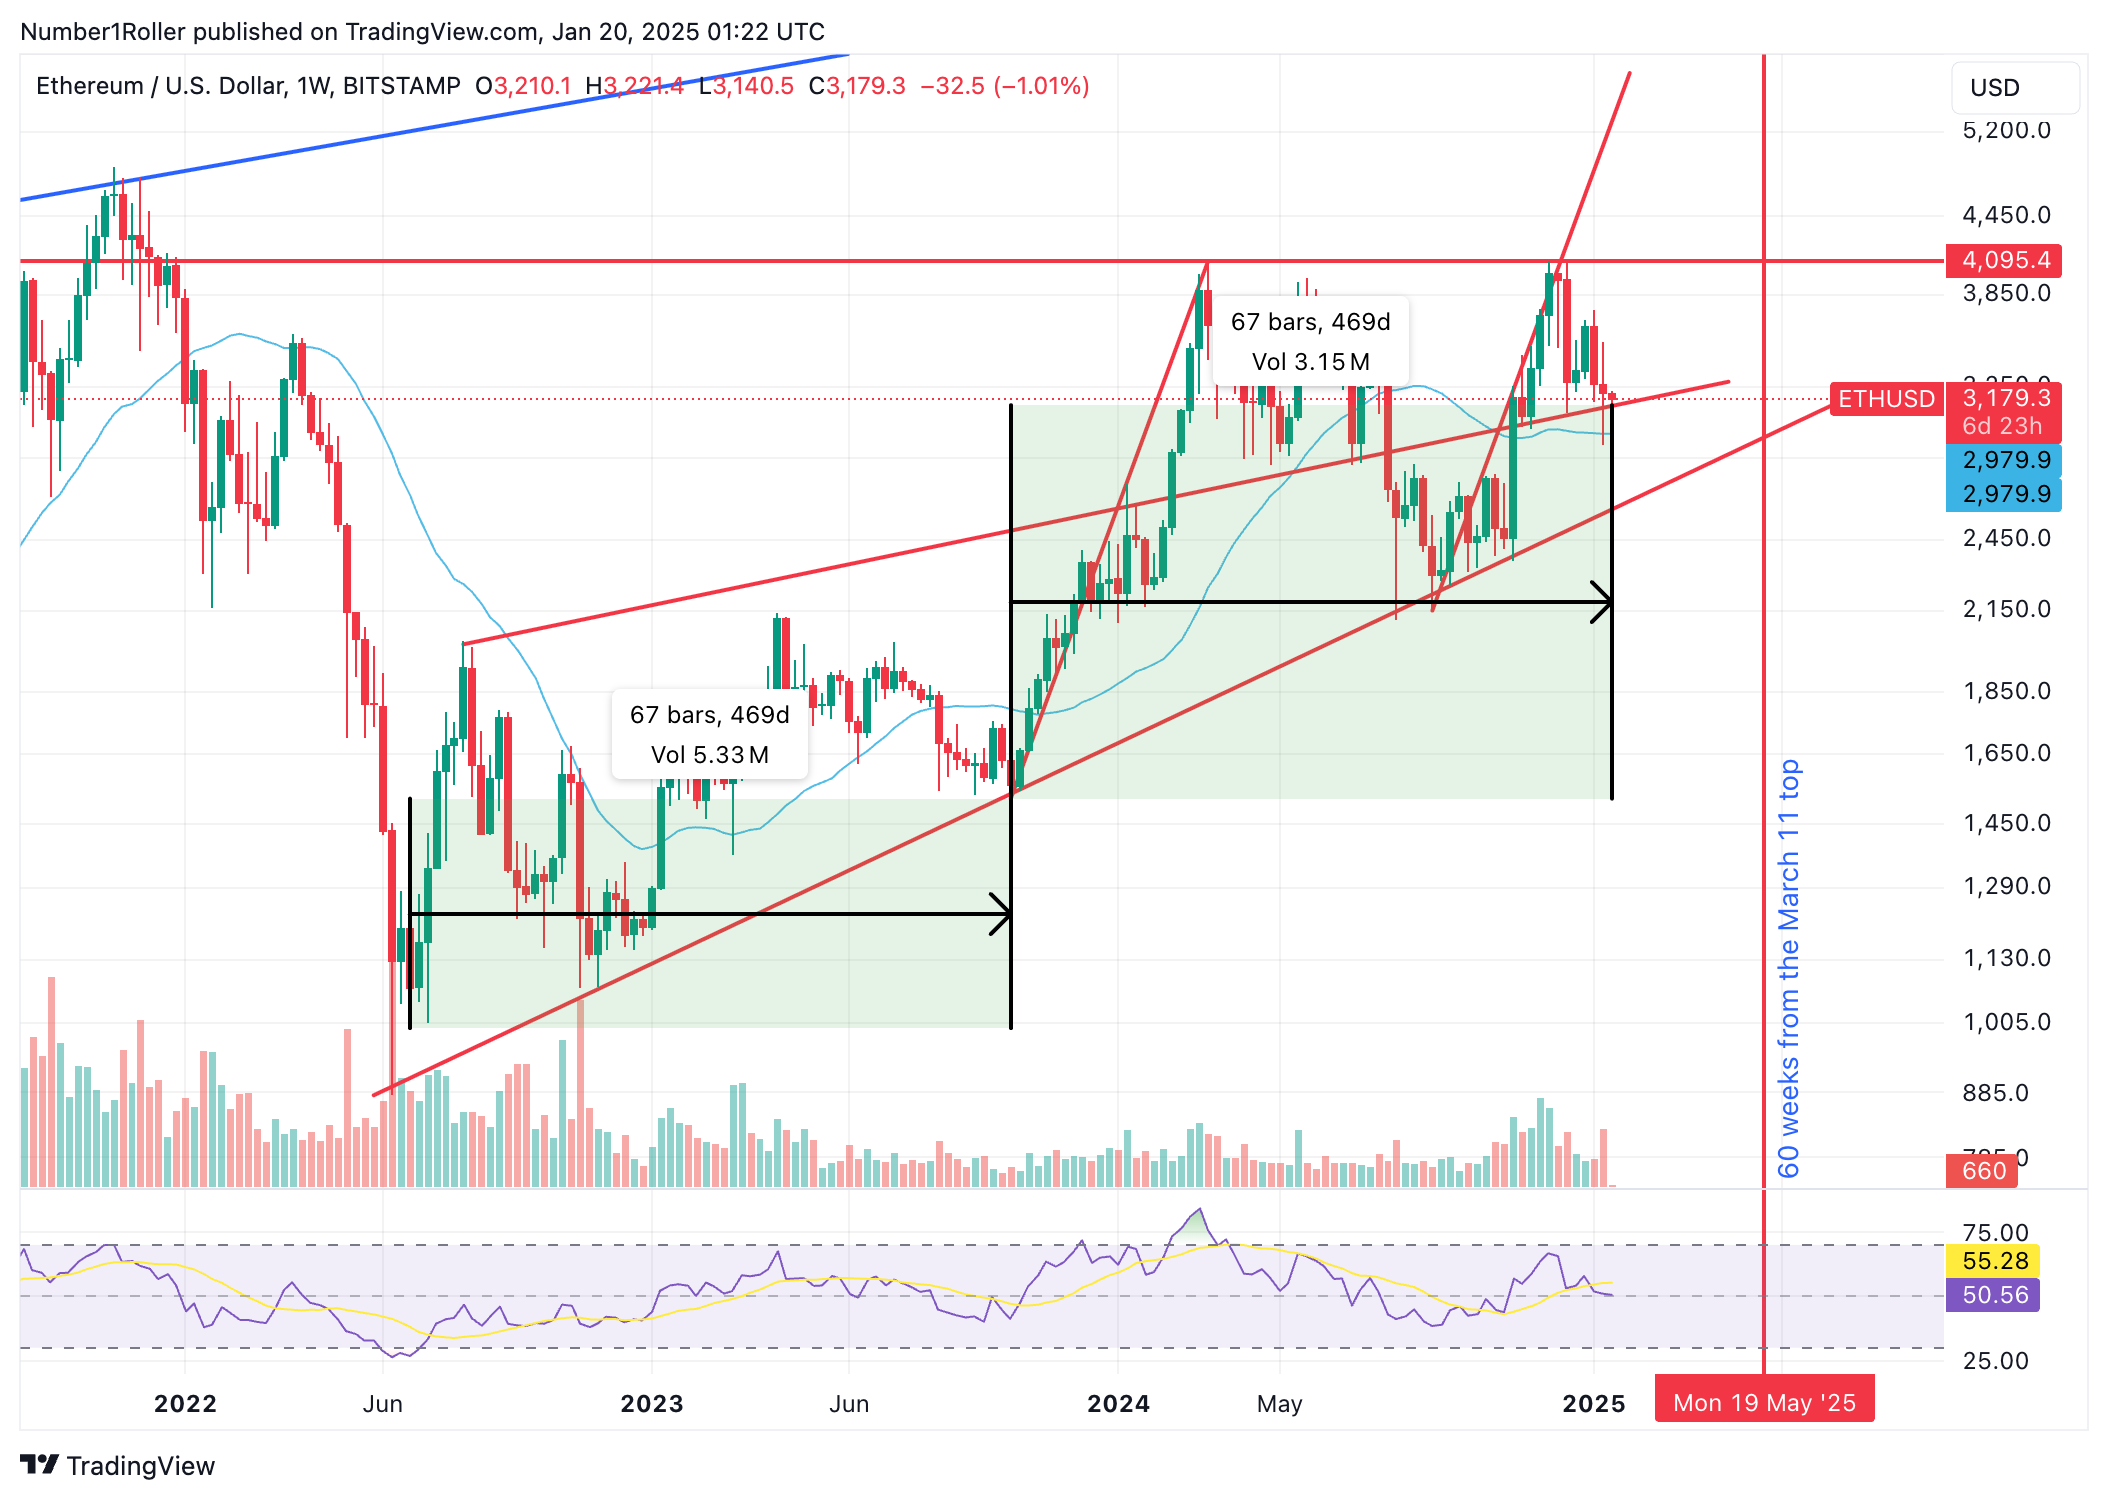
Looking again into the two moves we have seen this cycle in ETH and the respective accumulation periods.
We can see that ETH from the low of the weekly close to the major low in 2023 gave us a 67 week range low to low.
From that major low to where we are now gives us a 67 week range low to low once again.
We have to see this as an equal range in time and a very strong candidate for a weekly inflection point given the confluence with the 45 week midpoint.
Position of The Market
Lastly, I just want to remind everyone that the single most important part of analyzing a market is the position of the market.
That means when you look at a market you ask, is it running up longer than it’s running down?
And, is it making higher bottoms and higher tops?
If so, you are in a bull trend and the market is a bull market.

We can plainly see that this is the case for ETH. It has consistently made higher tops and higher bottoms on the macro time frame. Therefore it’s a bullish trend.
Finally, just as an idea I pointed out on X I have shown below the similarities of XRP accumulation phase and ETH.

Now, I’m not saying this is going to happen to ETH. But what I am saying is that ETH is in a very very strong position as a price action would indicate that it continues to be bought up at higher and higher prices throughout its accumulation phase.
The setup is in fact much more sustainable and much more bullish than a 2017 or 2021 style chart.
Conclusion
What’s brewing under the hood for ETH I can’t say for sure. It has been by no means an easy run to hold onto but you have to weather the storm in this market if you want to make it.
What I do know is that this is a very strong pattern of long term consolidation and when it is able to break that 4,000 level I doubt it does so quietly.
It could be any number of things but the first and most obvious could be ETF staking. Trump has elected to do his DEFI project on ETH so who knows what institutions and other billionaires are quietly building on their own right now.
One interesting week to watch would be the week of February 10th as it falls 30 weeks from the launch of the ETH ETF and also coincides with the seasonality in February.
Make no mistake ETH is in a very strong position but at the same time has been relatively weak compared to other crypto assets.
That is the catch 22 of this scenario and why this cycle has been so hard to hold ETH.
However, each and every-time hate of ETH has reached this extreme sentiment we have seen a huge bounce.
Given the position of the market, the midpoint of the 90 week cycle, the February seasonality, the equal time ranges, the similar accumulation patterns, and the horrible sentiment, I believe ETH should start performing much better in the very near future and likely cross that 4k level by middle of February.
I wouldn’t be surprised to see some very bullish developments in the next few weeks.
I am not going to say its ready to have a huge outperformance that much remains to be seen but the timing of the cycle is still very strong and the patterns line up for a substantial move higher in the coming weeks which will bring much needed relieve to our portfolios.