
Rare Signals Aligning
If you’ve been following lately, you know I’ve been hammering the 5- and 10-year cycles in BTC but today, we’re taking it a step further. This week’s data is flashing some of the rarest signals we've ever seen across both crypto and stocks, and it’s backing up everything I’ve been laying out. When the pieces start coming together this clearly, you can’t ignore it.
In this report, I’m walking you through why these cycles matter, what the latest data is screaming, and how historic signals are setting the stage for a massive move. I’m also breaking down the time-based rules and showing you exactly how 5, 7, and 10-year patterns are converging right now in a way Bitcoin has never seen before.
This is the kind of rare setup you only get a few times in a decade and today I’m giving you the next piece to the puzzle.
Rare Signals
I have been highlighting the 5 and 10 year cycles recently but let’s add onto that some of the data we are seeing this week that back up those statements that rare signals in the market are being triggered for both stocks and cryptos.
First, we have this chart from Glassnode that shows that BTC ETF just put in the biggest 2 day inflows in history. Compare that to other notable spikes in this indicator and they are on par with the huge runs we saw in early 2024 and then in late 2024.

Additionally, turning it over to stocks, all the noise last week was about the rare ZBT signal. For context you can read the X post below but in short this signal has never been wrong. A broad market rally is underway not just a few stocks here and there. There is a lot of noise and data out there so I am not a huge fan of sharing this kind of stuff but a rare signal with 100% accuracy like this is a welcome sign in my view.

But now let’s look at what the time is telling us about these rare signals. Data is great but time is always the strongest evidence we have.
The chart below is a chart I shared in the chat last week aligning the 5 and 10 year cycles in BTC. As you can see the 5 year cycles are in green and the 10 year cycles are in black. This is only the fourth time in BTC history that these two cycles have aligned perfectly.
all time low
2015 bottom
covid low
today

Each time it has signaled a MAJOR market bottom and each being a panic low or cycle low. On average the market runs up 24 months from this setup. The shortest duration being 19 months and the longest being in 2017 cycle with 36 months up.
7 is the Basis of Time
Read the rules of Gann on this and see how his rules on time continue to work on all markets and all assets. It’s pretty remarkable with what you’ll see in the charts below.

The monthly rule of 7 is clearly in effect on BTC. Just measure 7 months from the FTX collapse and it give you perfect monthly lows each and every time. (not to mention the no more than two month reversals which gann also noted in a bull trend)

From these lows the average move up has lasted 4.5 months in time and gone 100% in price, again thats the average. That would put us exactly into August with BTC trading near 150k in price.

Finally, just to give you even more evidence of how powerful the 7 year cycle rules are let’s zoom out.
Apply the 7 year rule for lows and the 2011 low calls the 2018 bottom perfectly 7 years later. Measure another 7 years from that low and you get November 2025 which is exactly 7 months from the recent monthly bottom.

Now we’re getting a little ahead of ourselves but you see why I am starting to see a major signal to watch November 2025. We have the monthly and yearly cycles aligning for what has historically been a cycle of major lows.
We will continue developing this 5/7/and 10 year cycle picture for you over the coming weeks so remember these dates and cycles as we slowly piece it all together.
5 Year Cycle
Now to track some of the cycle maps I have been highlighting starting with the 5 year cycle which was the covid low. Please keep in mind that these are better for time and inflection points rather than actual price points.
This one is actually starting to show the most accurate picture given the sharp recovery we have seen in BTC from the low so continue to monitor it closely and note how price stalled big time into summer.

5 and 10 Year Cycle
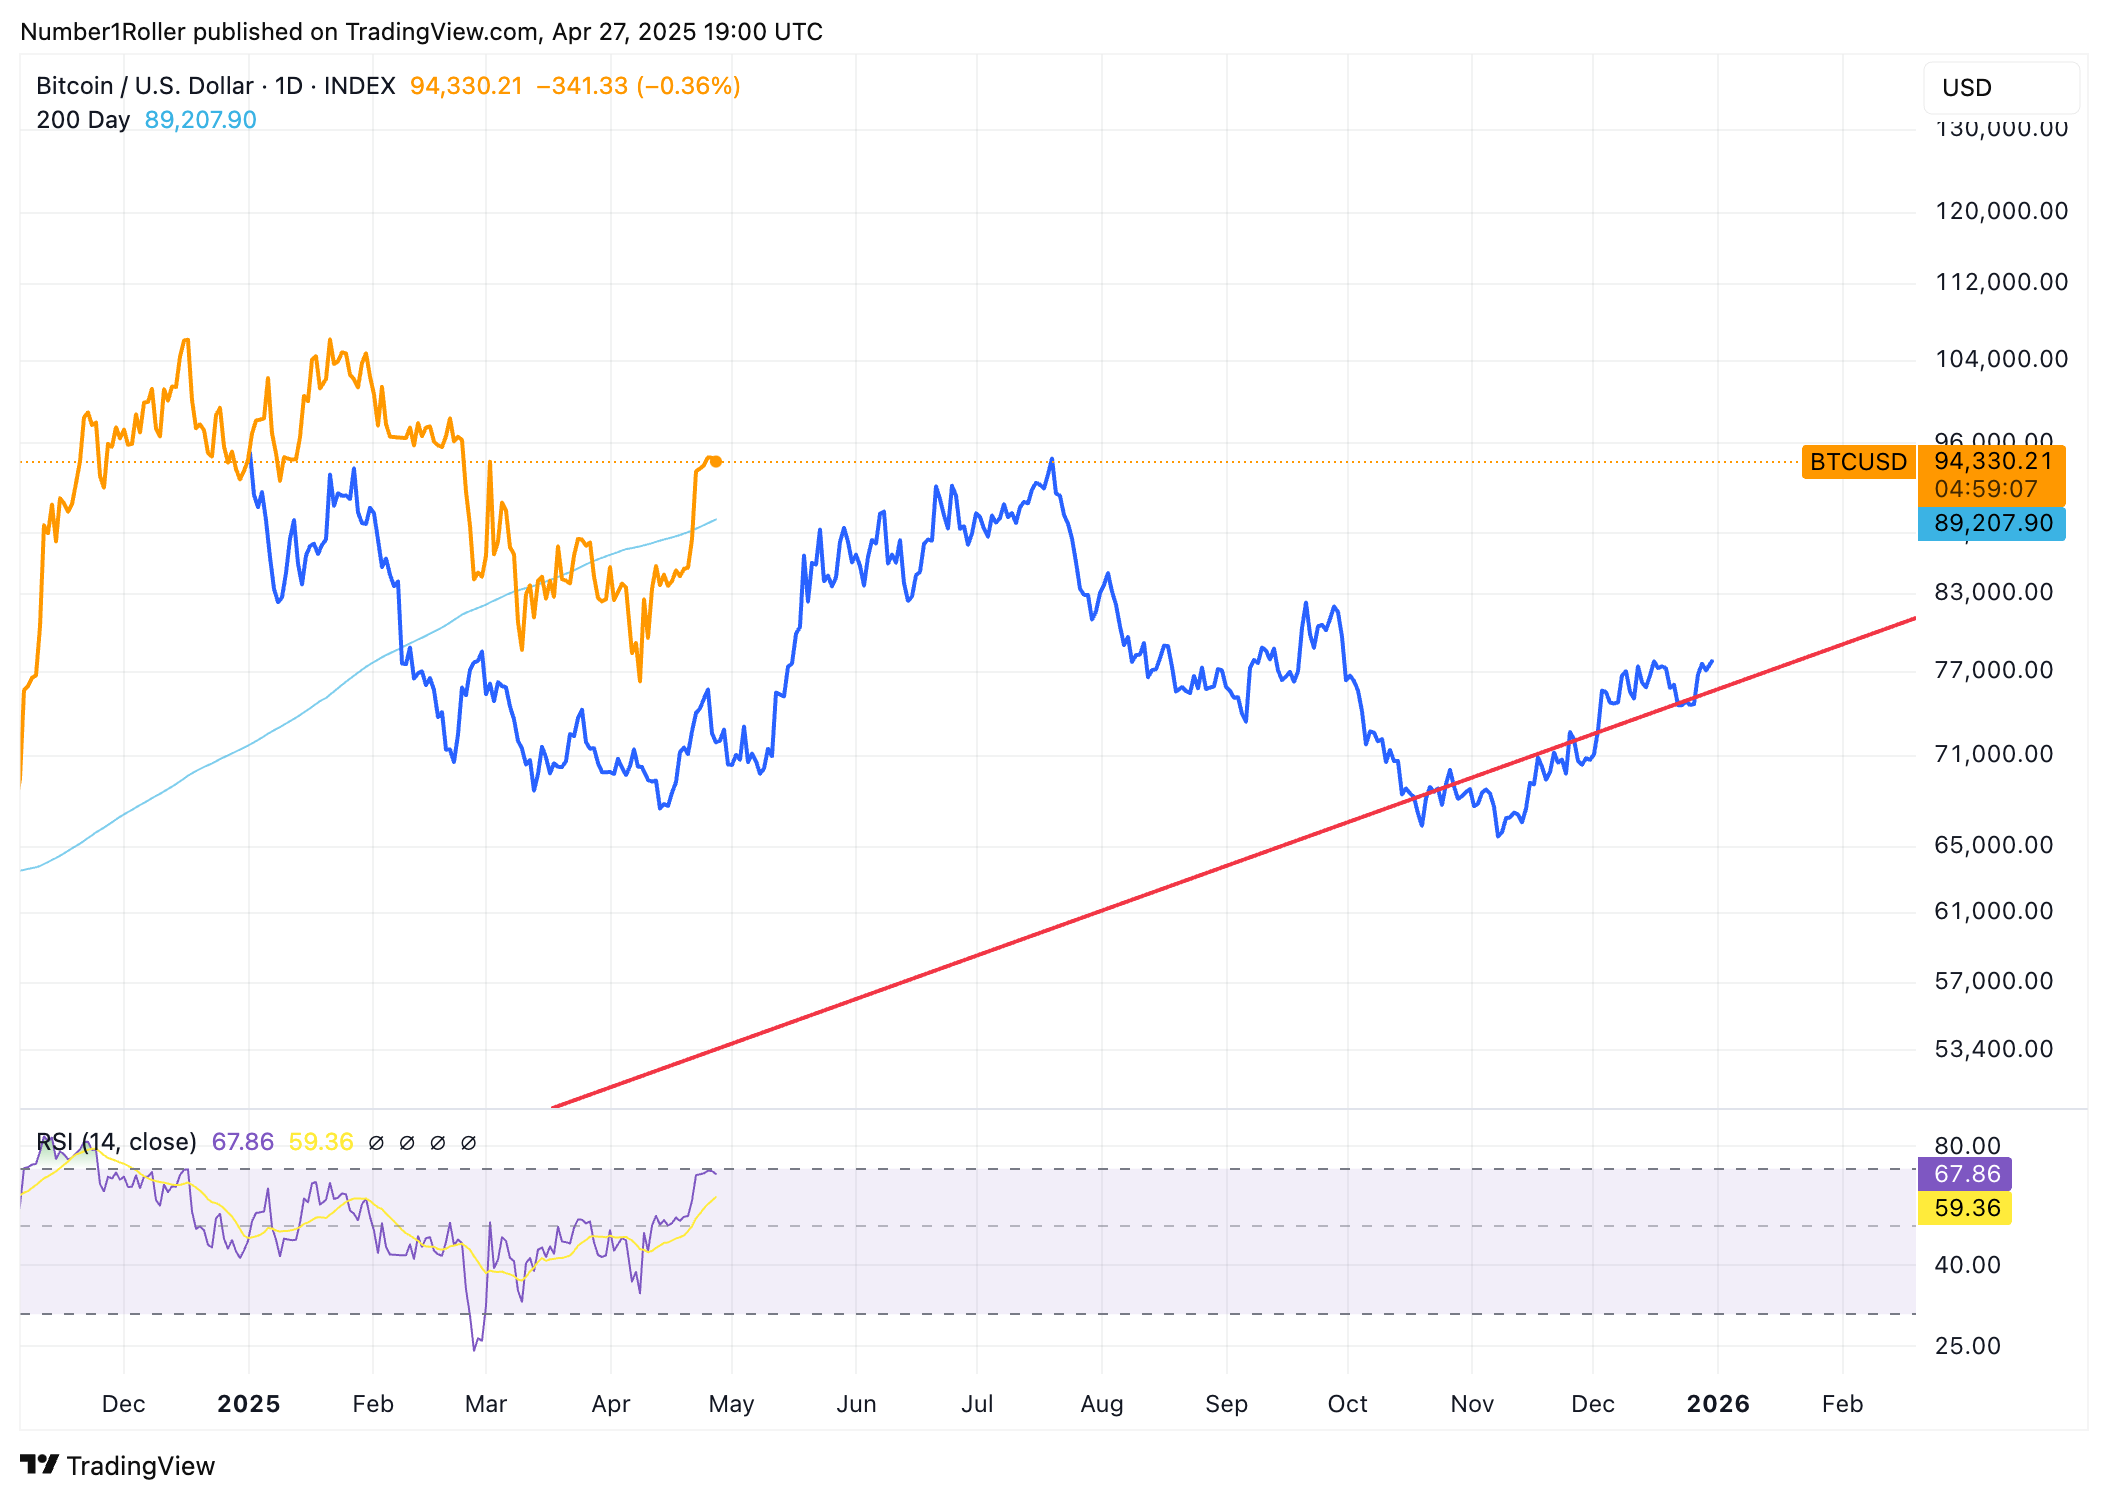
Then we have the 5 and 10 year cycles below which match the rare signal we got with them both intersecting again. The 10 year cycle in red has not been as accurate as the covid low with this early year price action.
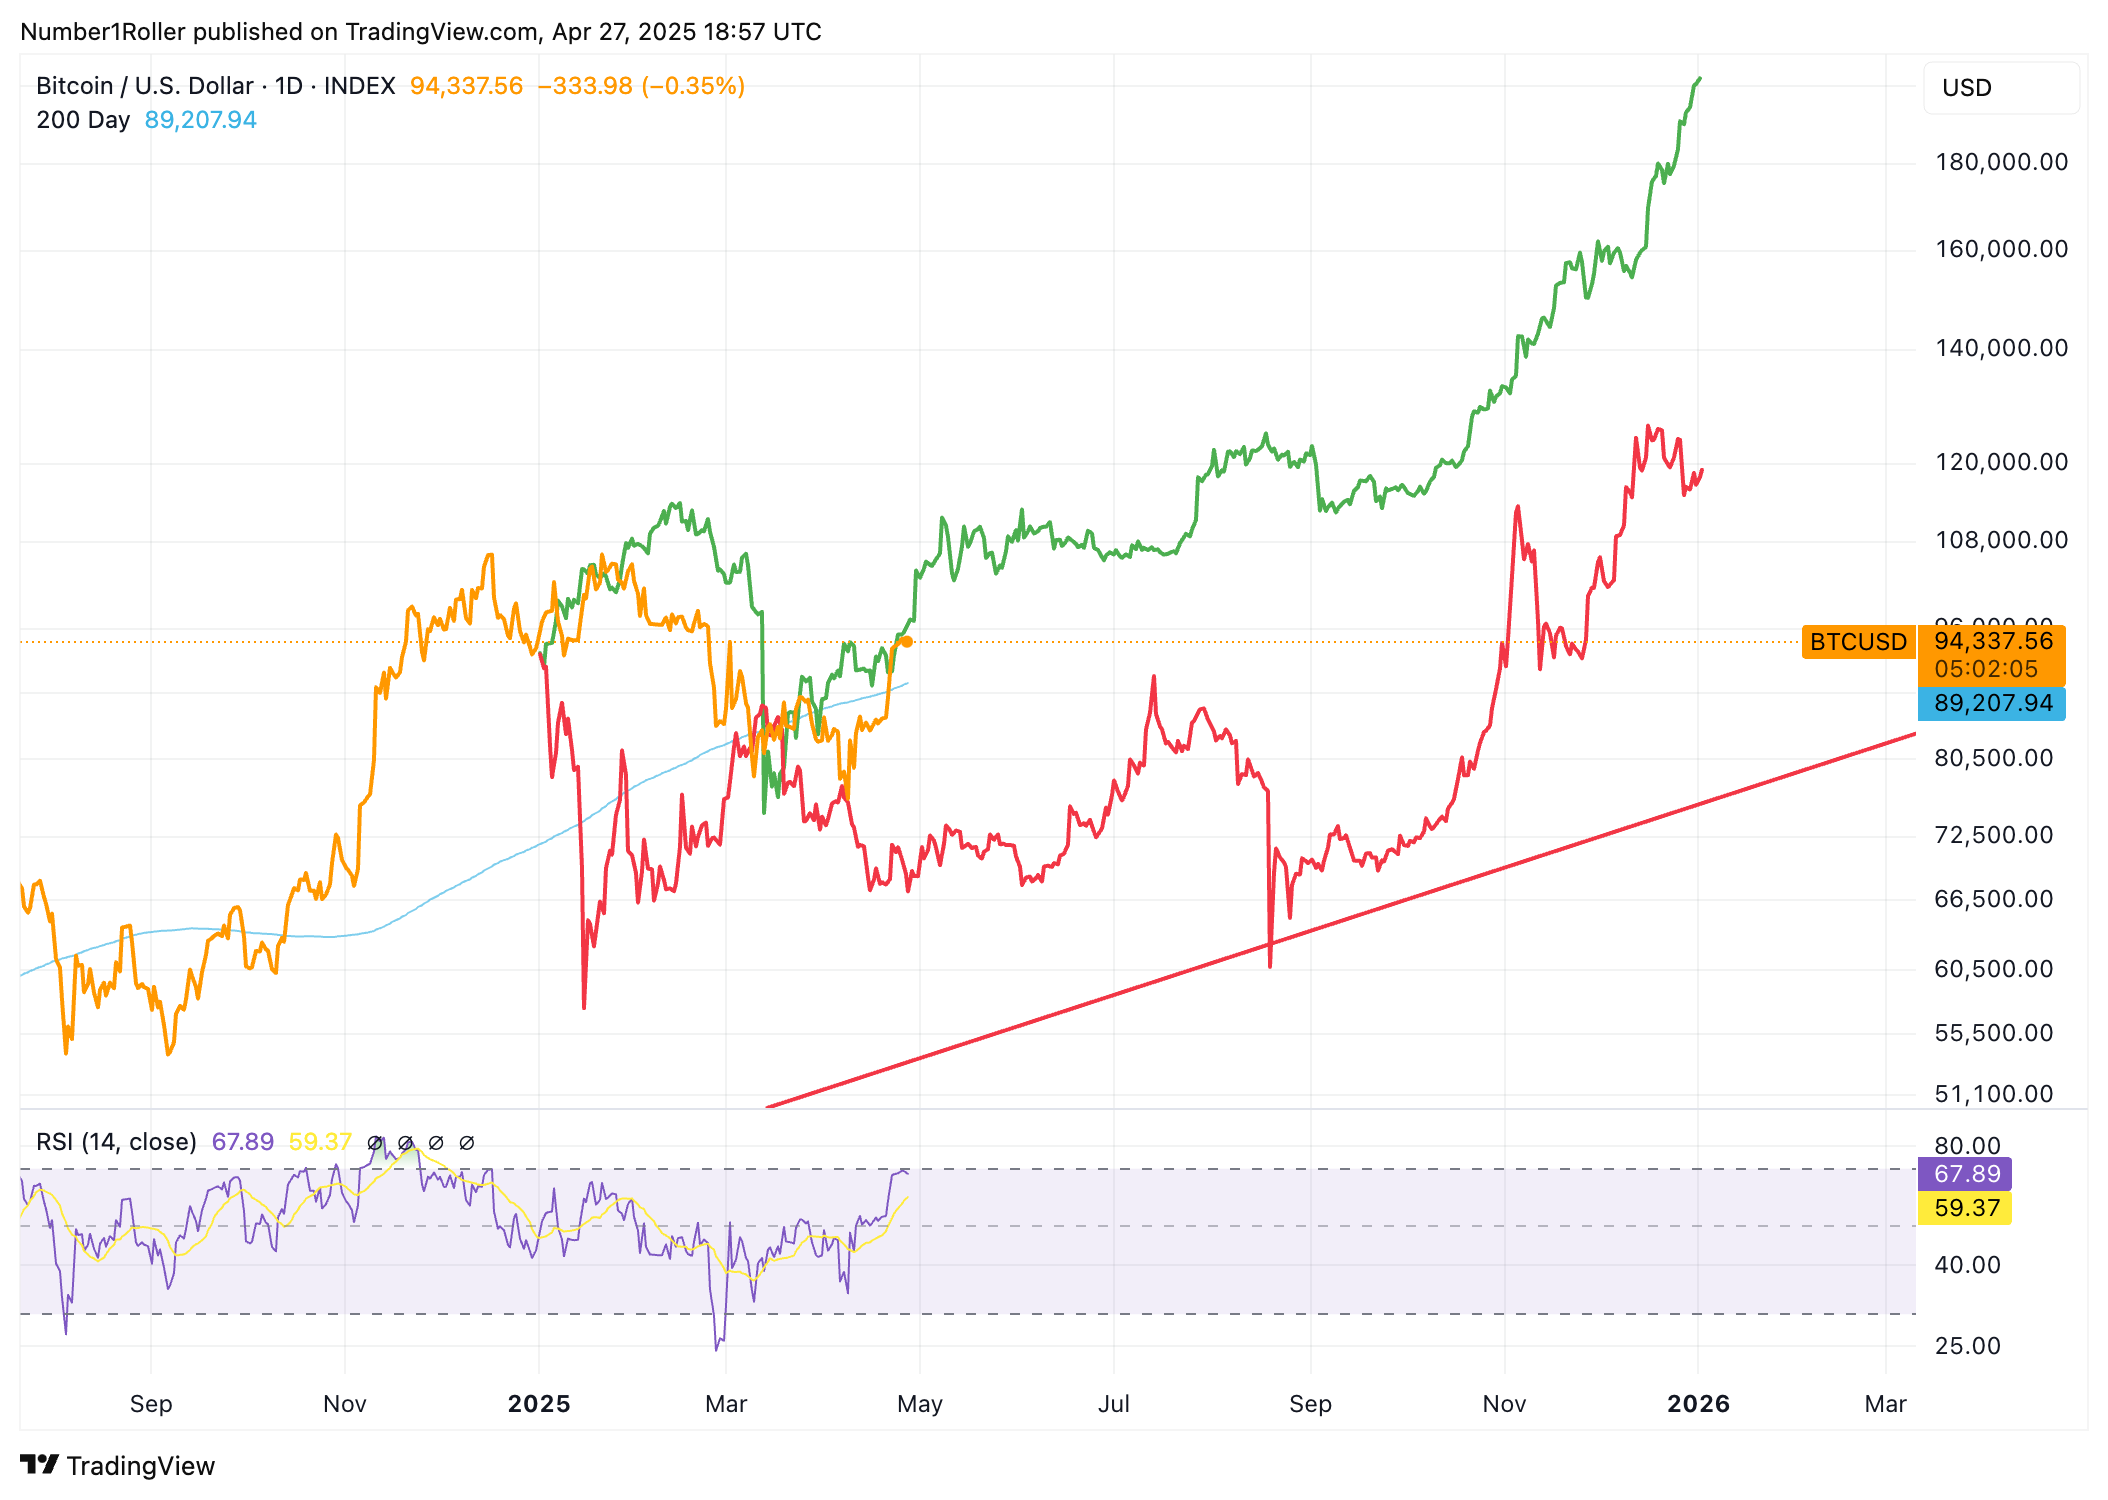
However, if we invert the 10 year cycle it gets a little more accurate but also a lot more ugly. Again it would suggest that the price would stall out near 100k levels and begin grinding into July with one last fake out into August before a very ugly Q4.

1 Year Cycle
Compare those again to the inverted 1 year cycle here. Again, it suggest a run up here and has been quite close in time but it shows it will be more muted of a run in price over the summer into August. Before again, another ugly and tough q4.
Conclusion
We are seeing a rare year begin to unfold with larger cycle signals at play. The conjunction of the 5/7/ and 10 year cycles in 2025 is something that has not happened before in BTC history.
This is certainly going to make for a very interesting run at the end of the year and navigating it will not be easy. As we can see from our cycle maps above they all suggest a bullish run over the next 3 to 5 months but then they deviate from one another as we cross past that August window with some showing the market heading south and others showing an even more spectacular run unfolding.
This is my number one priority right now to figure out end of q3 and q4 as it will be key to our success this year. For now we will be watching for a price breakout over 100k and then over to new highs. If not its a possibility we could stall out and grind around those levels until a later date as the cycles suggest.
In the meantime I have no concerns over the next few months as my bullish bias still shows a good runway ahead. In the shorter term get ready for some early May volatility as I outlined in my report last week. However, at this stage, as you know I expect no more than a two day or two week pullback at the worst. Yesterday’s close gave us the confirmation of price and time overbalancing on the weekly time frame giving us the uptrend signal and telling us it’s time to just sit back and ride the wave.
Would the two scenarios depend on the tariffs? If high we go into a recession q4 is ugly. If low, we see a a grind up?