
Why Ethereum is the Market’s Biggest Liar
While attention remains glued to BTC and macro fear narratives, a very different story is quietly unfolding beneath the surface. One that shows up not in headlines, but in relative performance, intermarket relationships, and long-cycle behavior that only appears when markets are preparing to rotate rather than collapse.
As the herd packs up shop and waits for the four year cycle bottom later in 2026, the most profitable structural shift in half a decade is happening right under their noses.
In this report, we are tracking the screaming divergences between global macro rotation and the crypto tape. We’re moving past the noise to show you exactly why the altcoin sector isn’t just ready to outperform but being pushed to do so by the same cyclical forces driving economic activity to record highs.
You’ll see that one of these assets is not like the others and history is calling its bluff.
From Bitcoin Fixation to Rotation Signals
It’s almost heresy to mention the phrase alt season in what has now been a 5 year bear market for the sector against the benchmark btc.
But as the great fund manager Stanley Druckenmiller once said, “Watch what is acting well, not what you think should act well.”
At this stage most are simply watching BTC and its four year cycle and thinking “good game, I’ll come back in Q4 and play again.”
But these people are missing the subtle cues that the market is sending and telling quite a different story as to what may be brewing.
First, I want to go back to a post I shared on August 20th of last year highlighting to fractals with relation to time that I saw as most prescient to the current state of bitcoin dominance and the ETH trade.
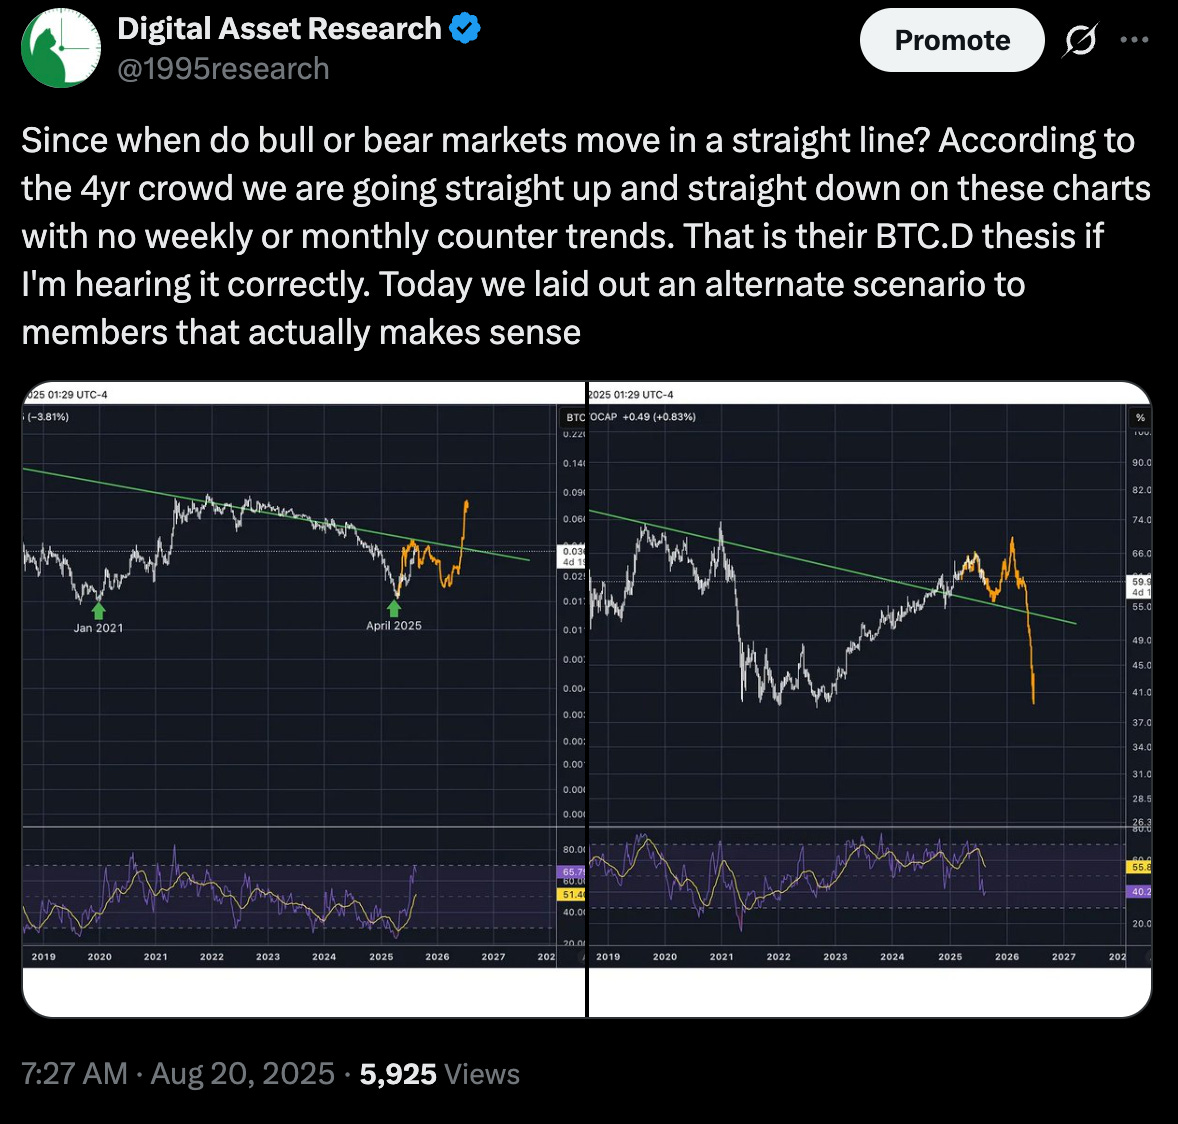
Now fast forward to today and without moving these fractals at all this is what they look like 6 months later…


I’m not a huge fractal fan as they generally just superimpose what the analyst wants to happen on the chart. However, going back and revisiting these after a period of time to see how right or wrong they really have been can lead us into some more clues about where the market really stands.
In my view the fractals have to be based on the cyclicals of the market and these appear to be nailing where we are in the cycle. That would suggest that you might want to be paying attention to alts while no one else is. If you want more chart based evidence go back and watch the video I made last week.
Ethereum as the Macro Canary
So we have an interesting looking setup in the ETH trade based on the above charts but how does ETH itself stack up with where we currently are in the broader cycle?
When Economic Momentum and ETH Diverge
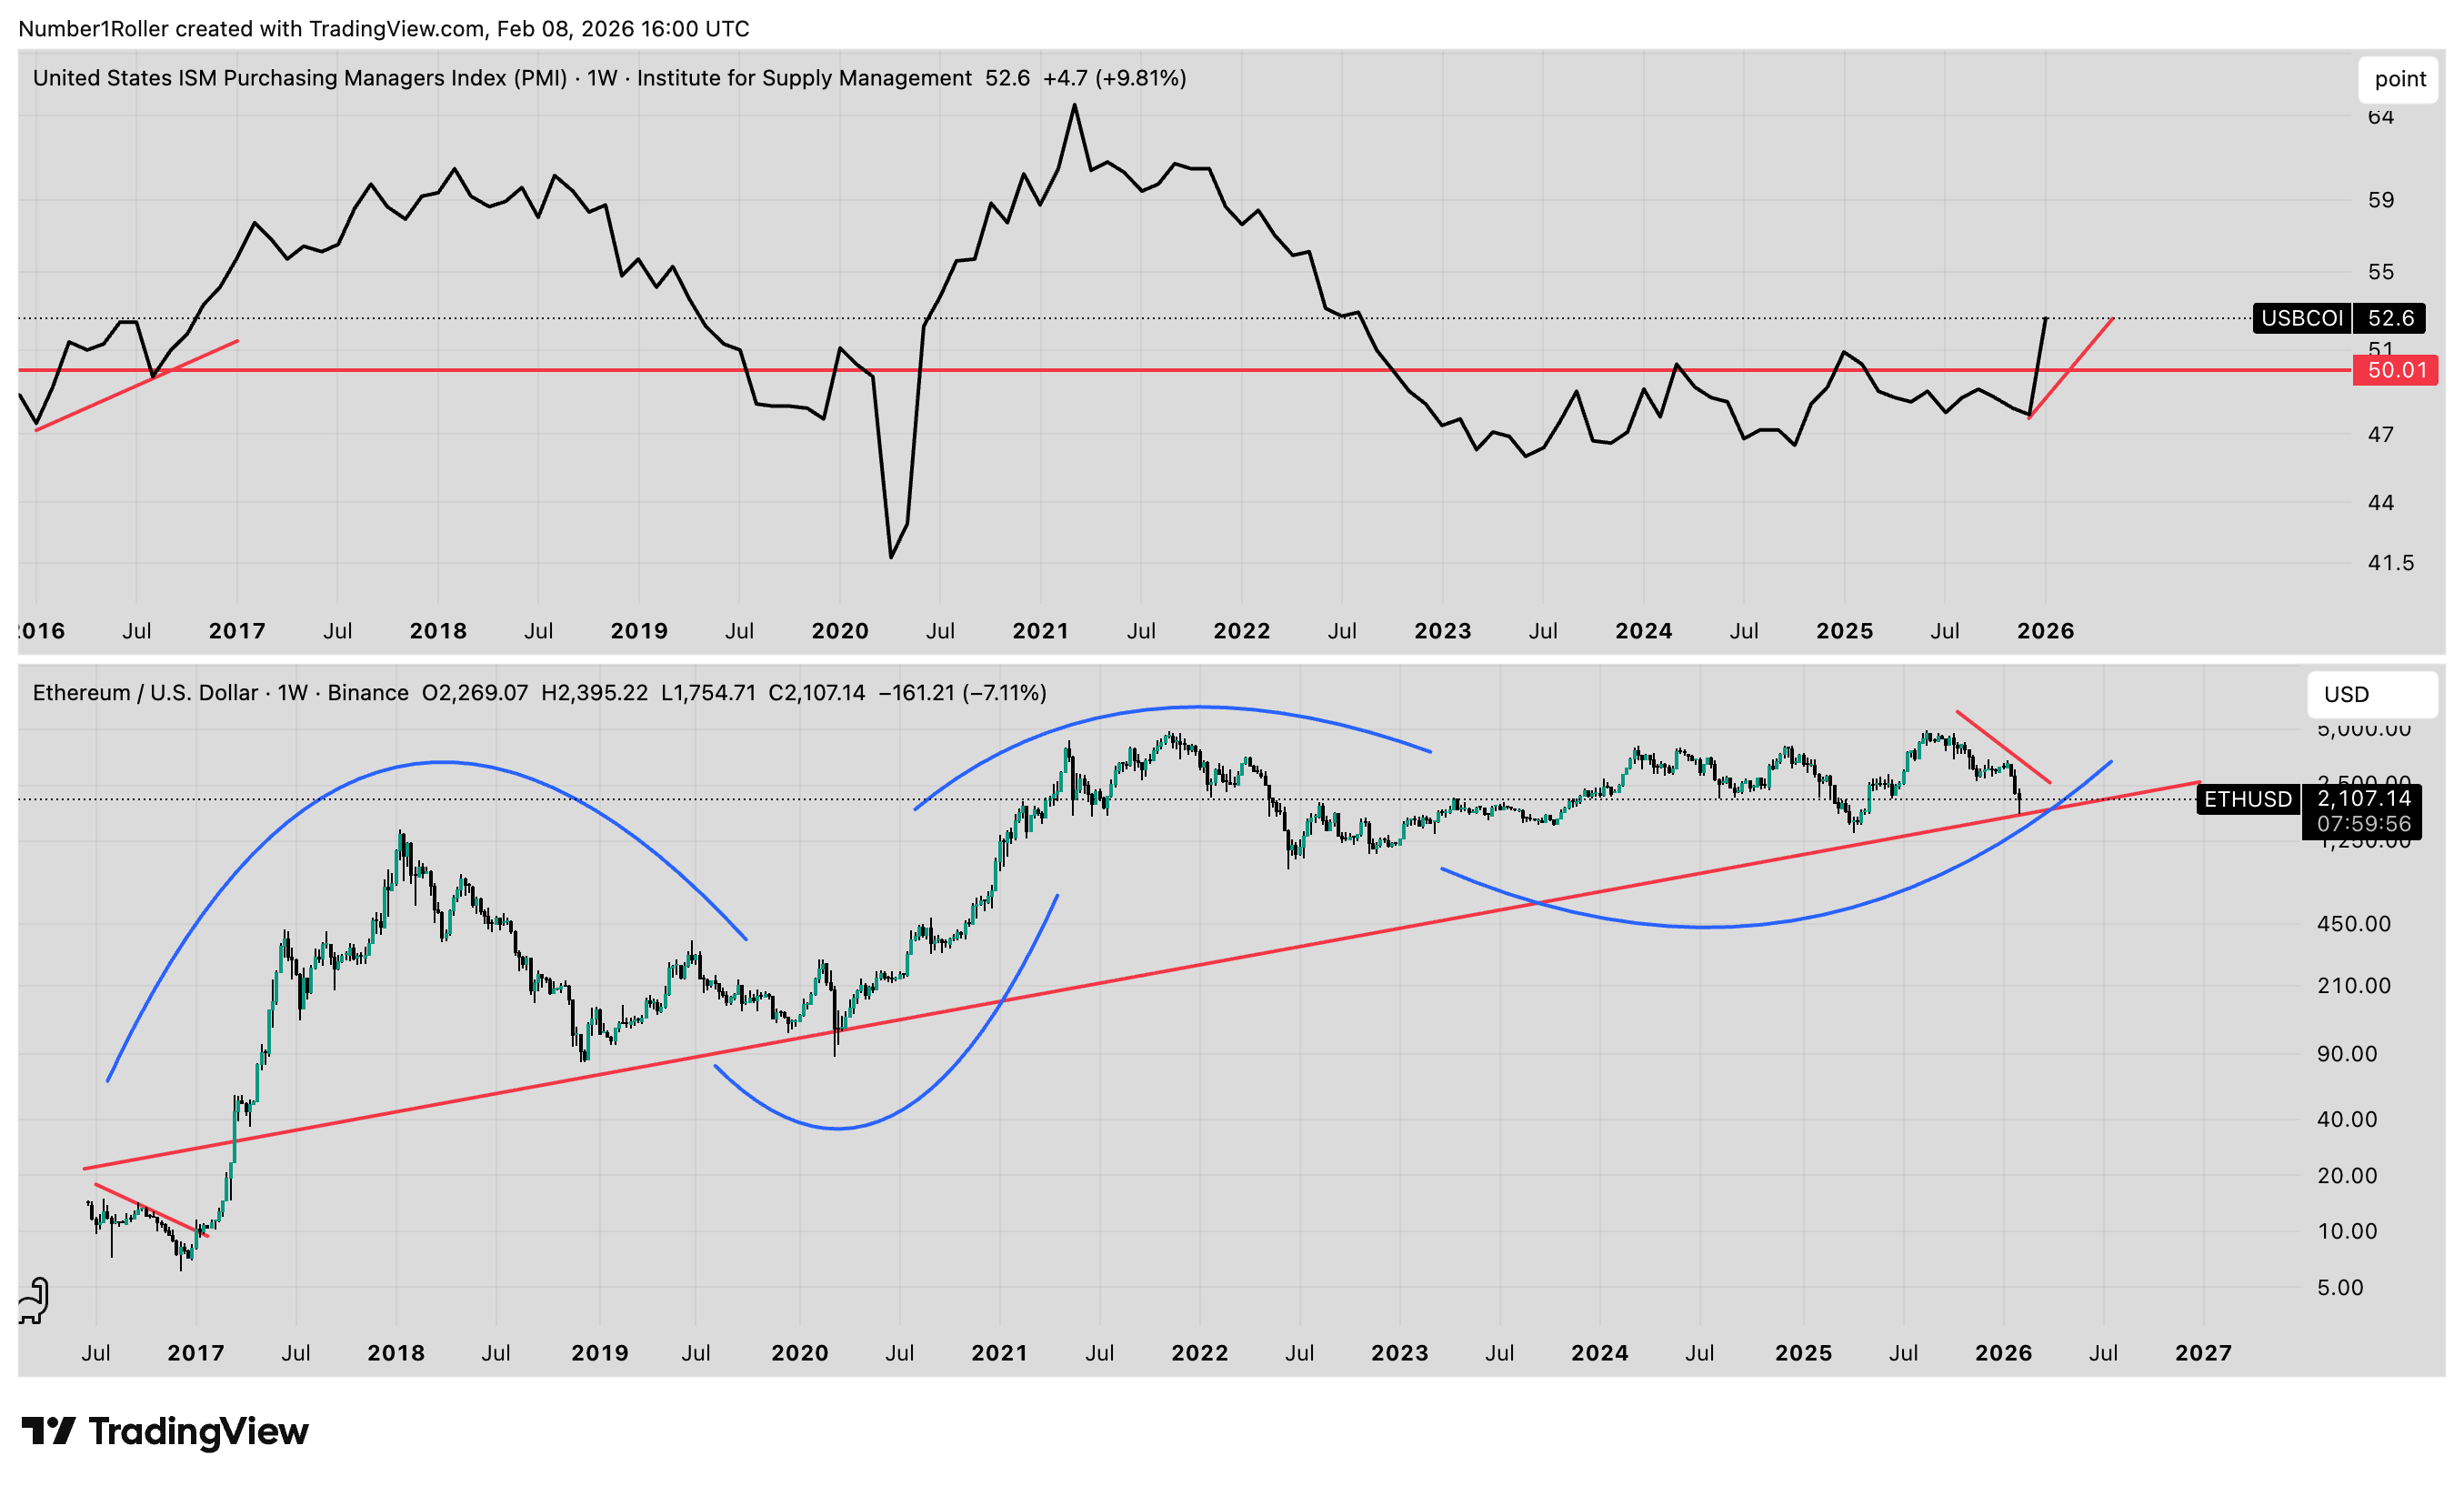
I want to first start with the ISM. I know this is boring as many highlight it but there is a good relationship in general although not a direct 1 to 1 correlation. You can see the overall major moves do in fact mirror each others structure. What’s rare when looking at this chart is that a major move up in ISM coincides with a major move down in ETH. The last time we saw this big of a divergence was 2016.
The ISM made headlines last week with a huge surprise on the upside indicating that economic conditions may be improving. The question is will ETH follow suit? history says its likely.
Consumer Staples Are Breaking Out — This Is Not Defensive
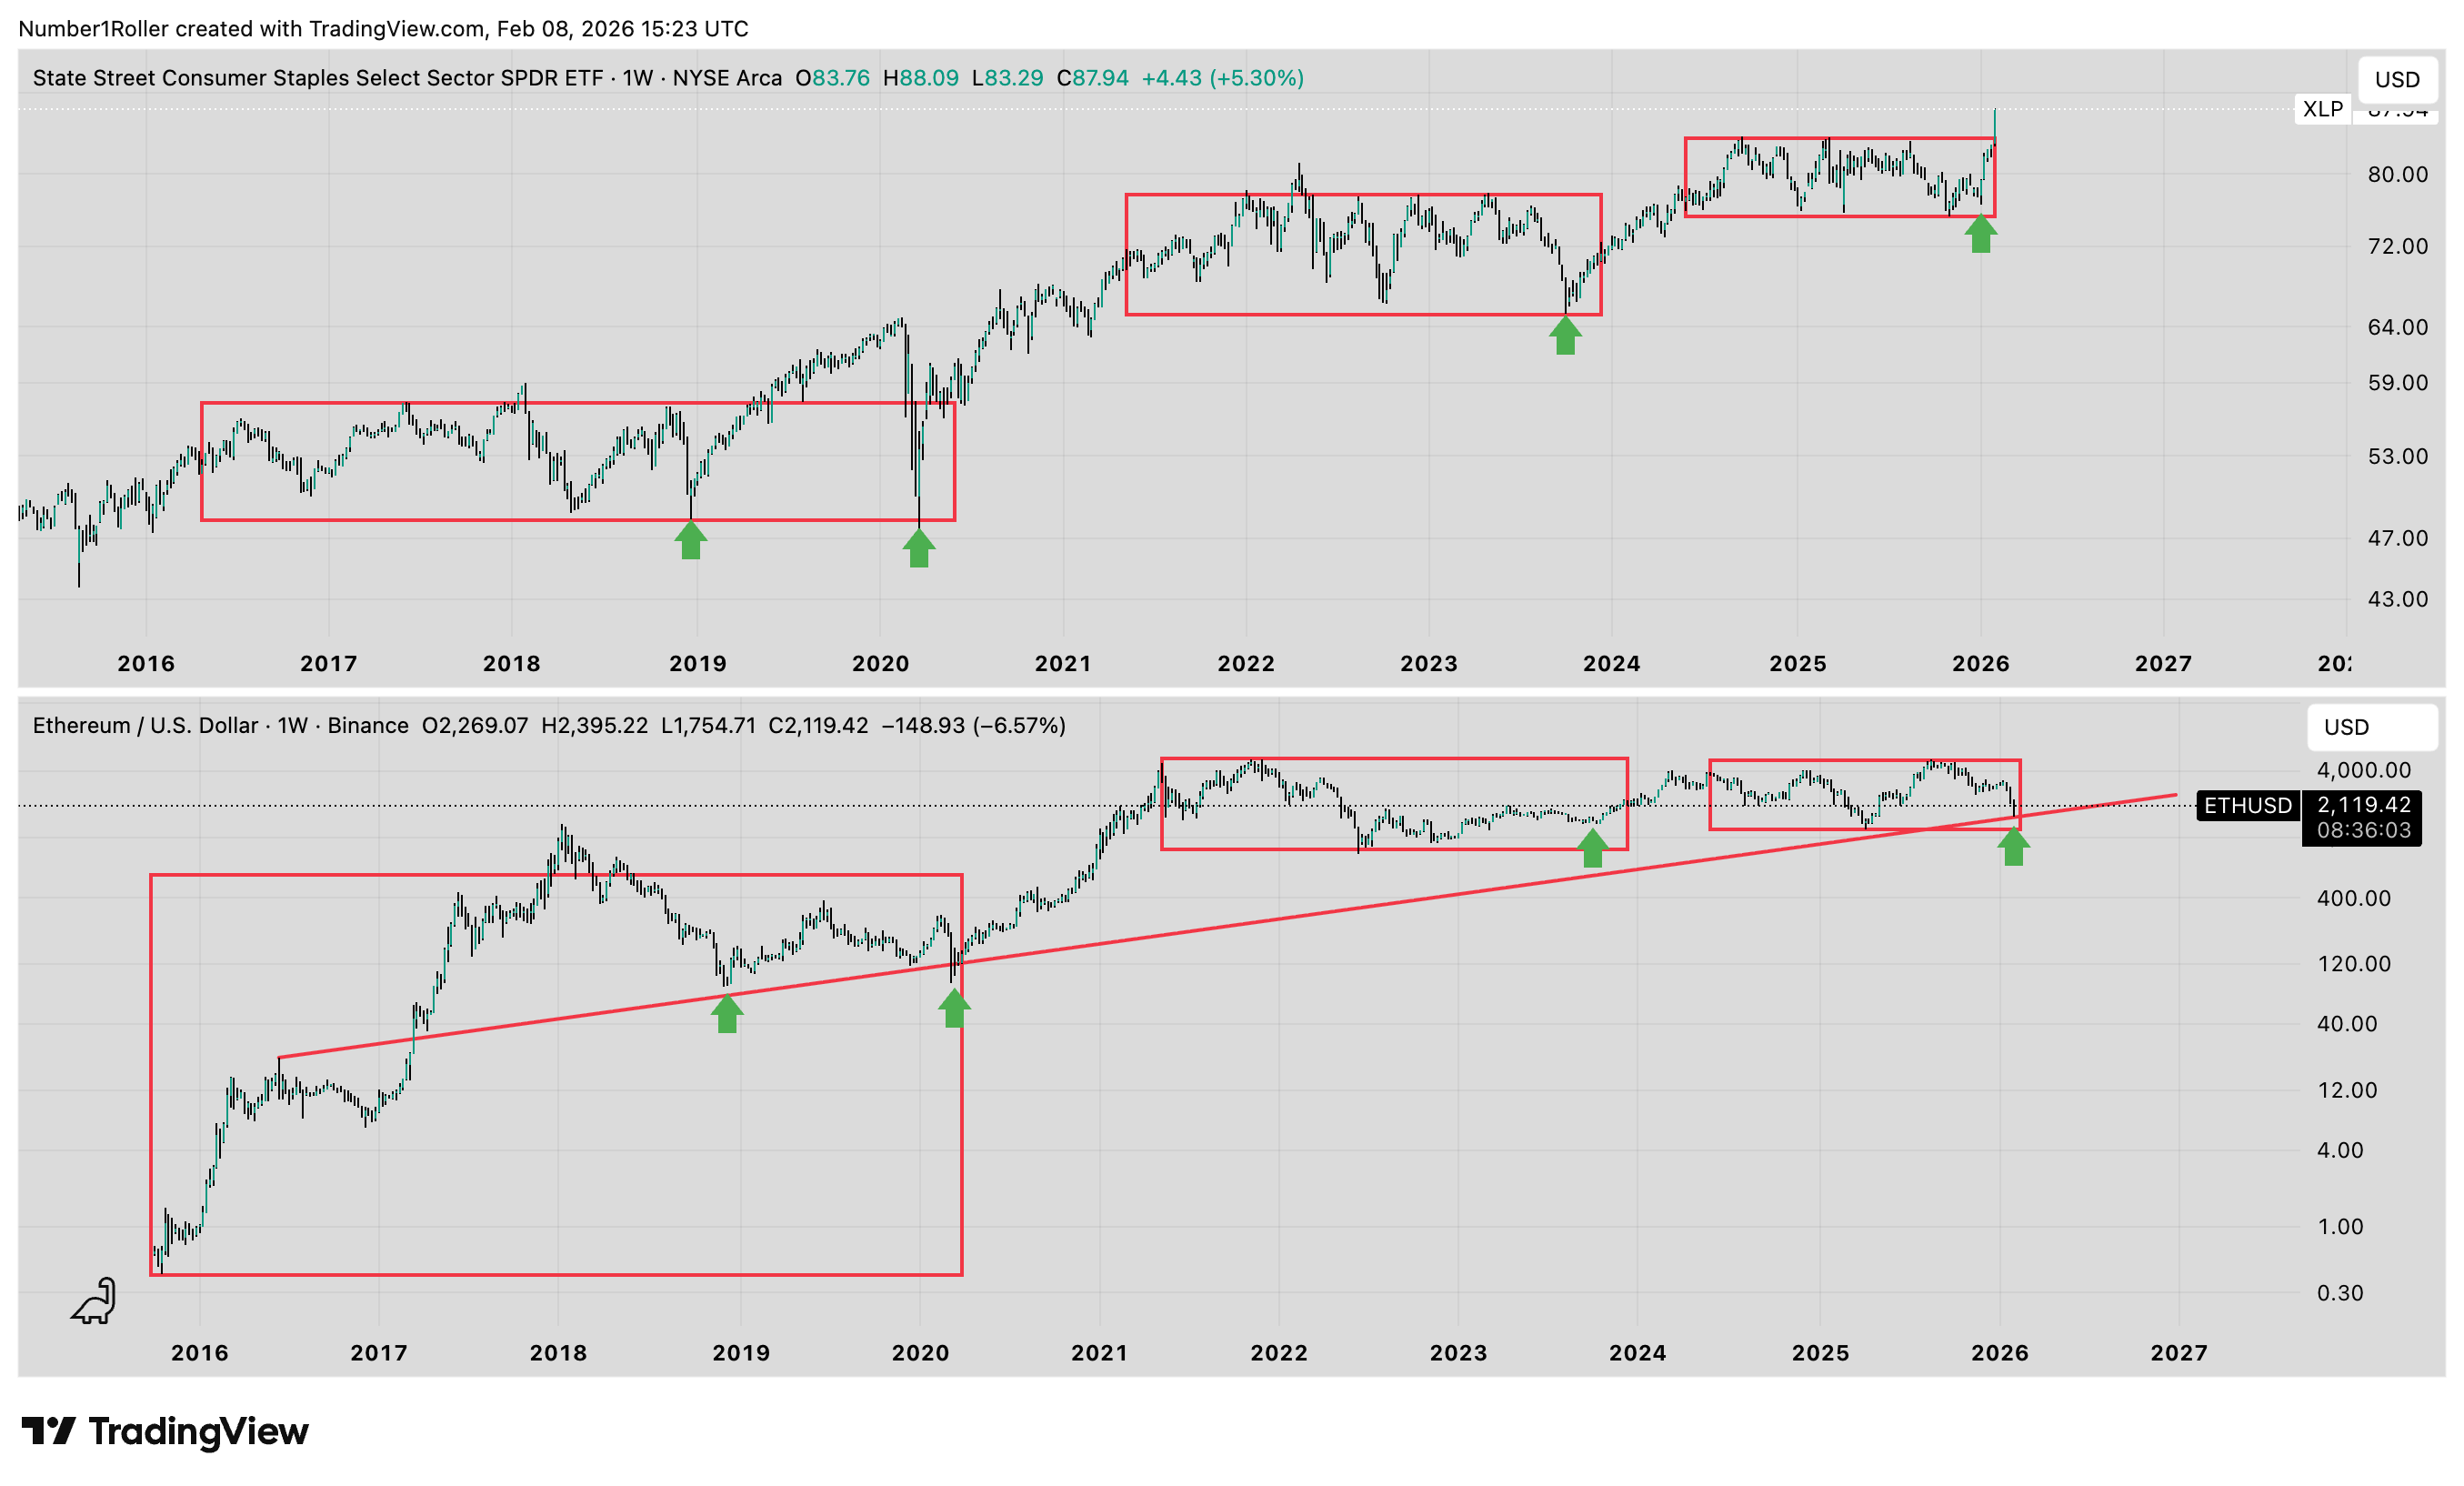
Another sector of the market that is making headlines recently is the XLP consumer staples ETF. Normally people see this as a defensive play in the market and a warning sign but when we look at in the context below I think you will see a different picture being painted.
XLP has a pretty consistent pattern of going through long sideways consolidation before having big upside breakouts. When we look at the boxes below that coincide directly with the boxes on the ETH chart we can see that we have had only 4 such breakout moves like this in the last 10 years. Each one of these moves correlated directly with big bull market moves in stocks, not defensive positioning. Furthermore, we can see that when these rare breakouts happen we also get a big move in ETH.
Right now this move in ETH is deviating from this relationship. So again, the question becomes which move is the liar? History would suggest the it’s the down move in ETH.
Airlines Don’t Lie About Risk Appetite
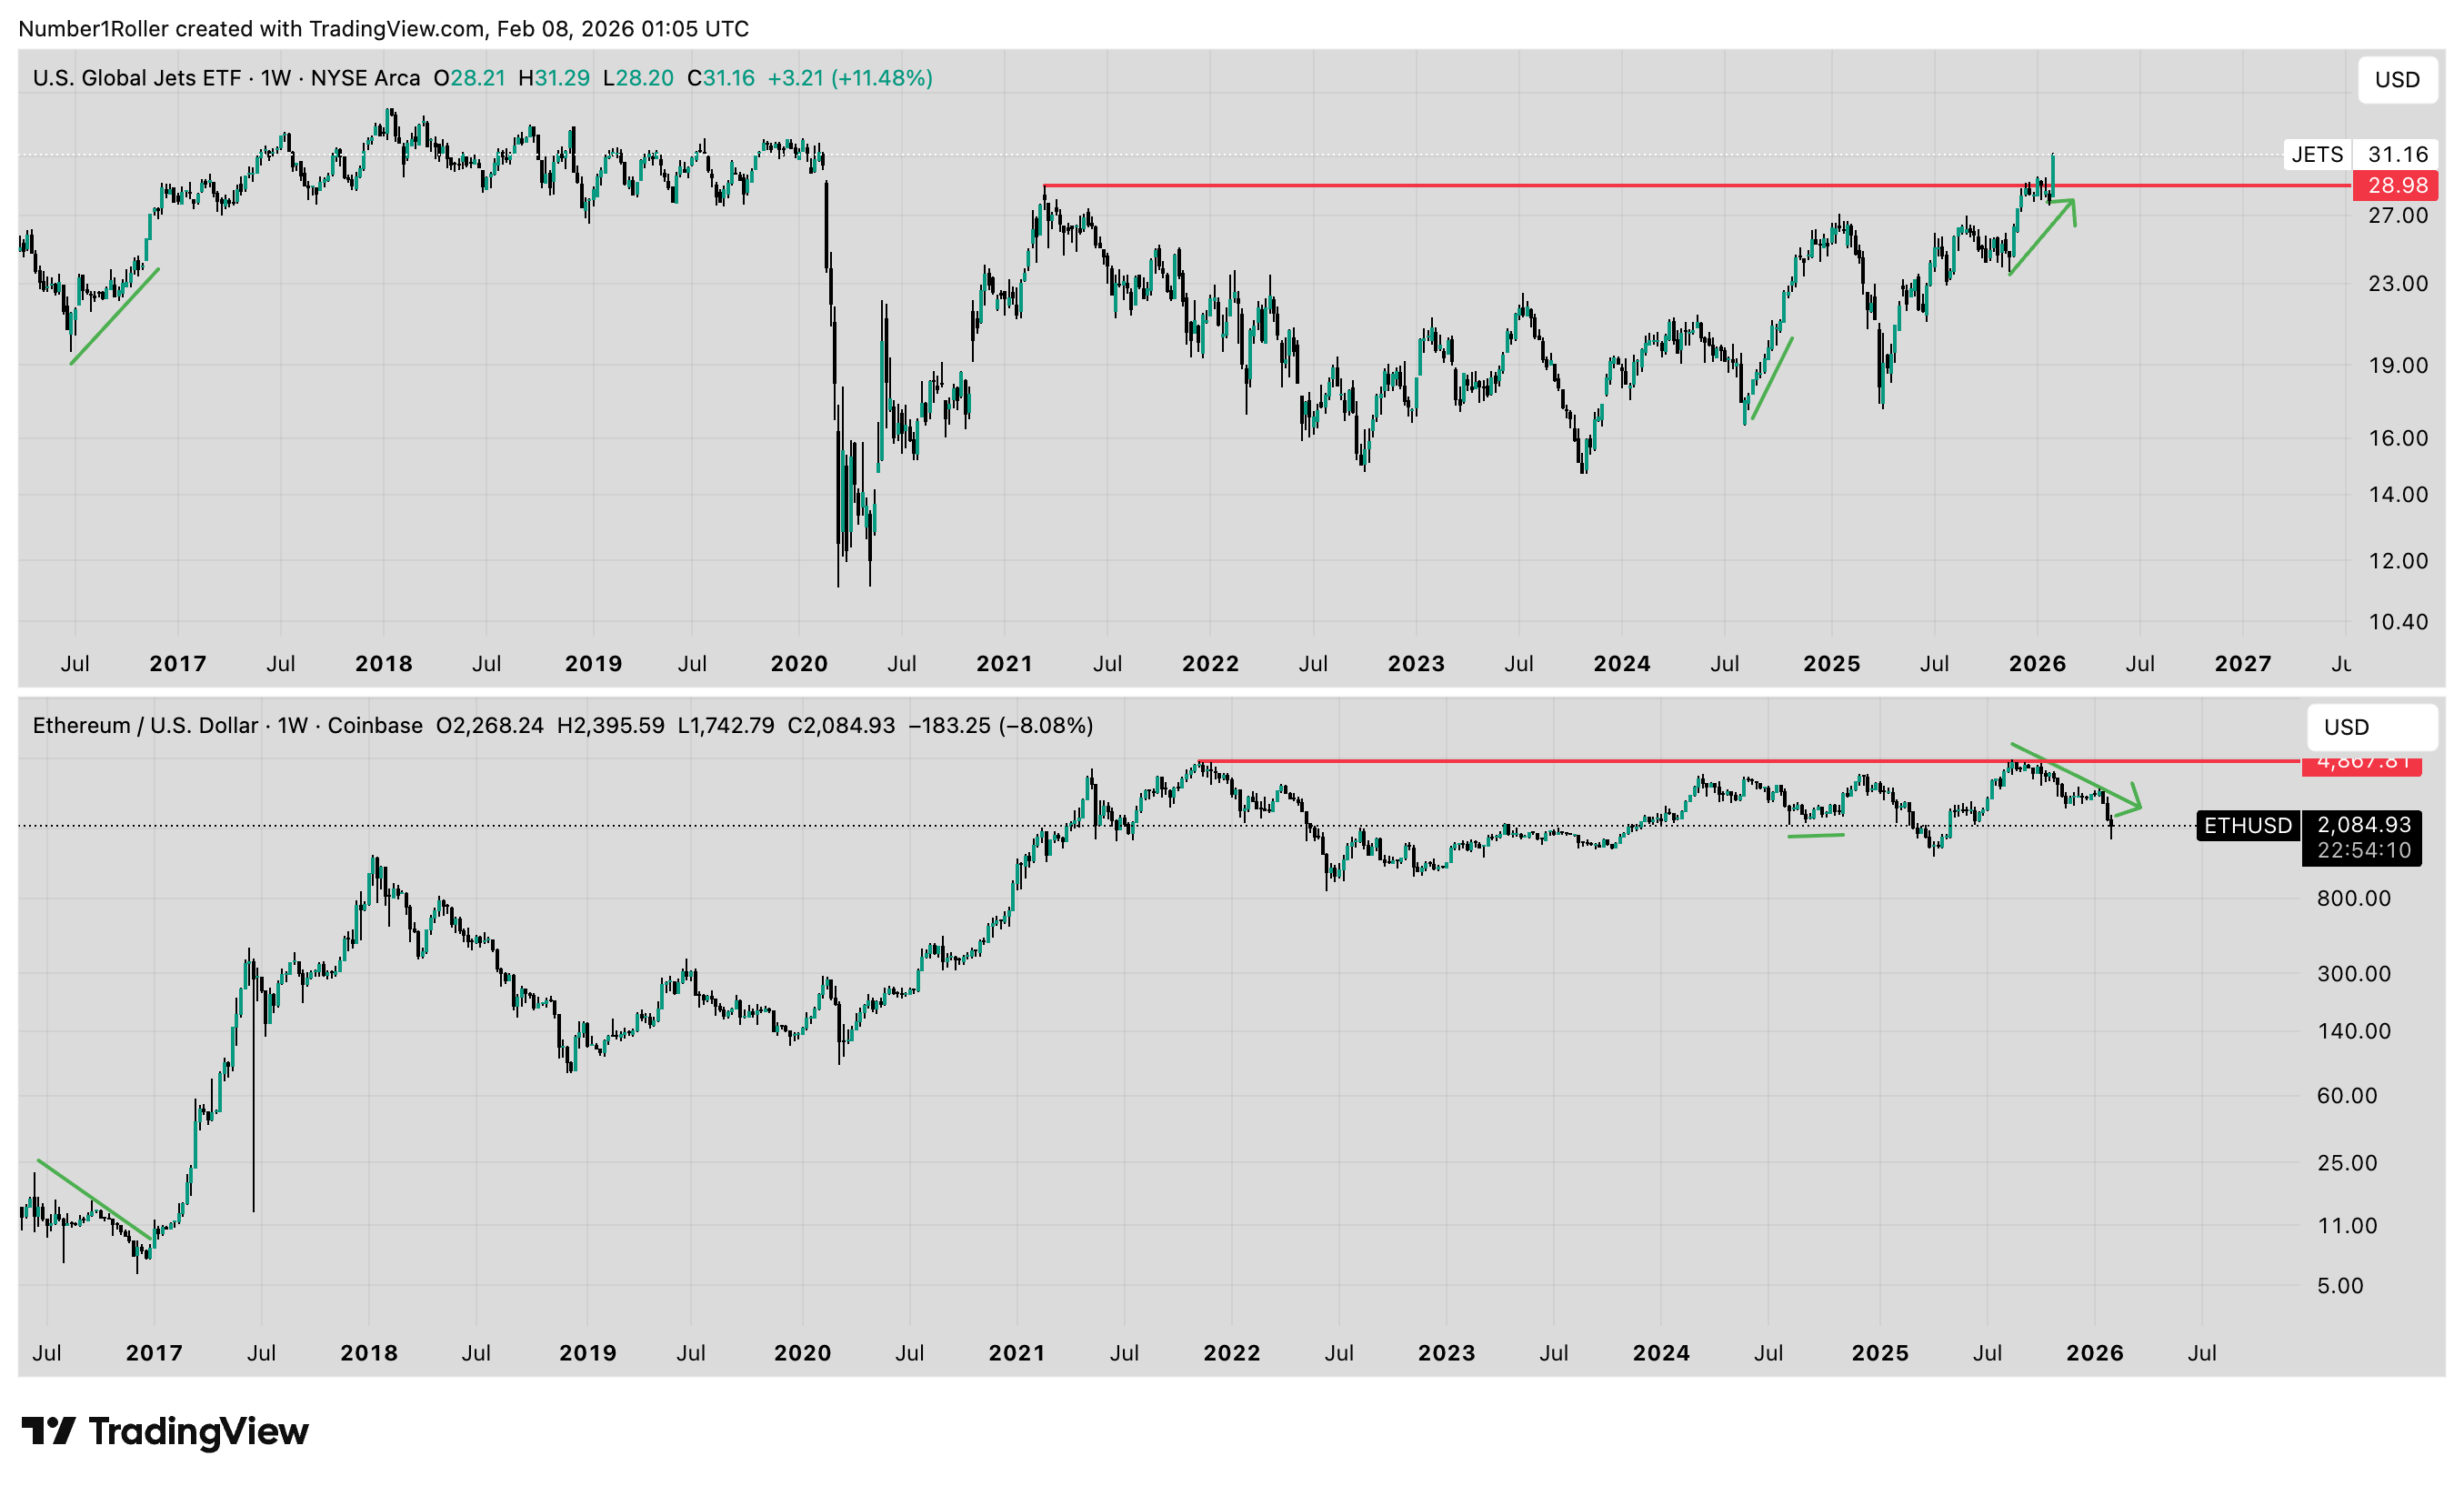
This next chart might be my favorite relationship that no one talks about, the ETH vs global airlines ETF.
Generally airline stocks go up when the economy is on strong footing. It signals that people have excess money to spend on travel and leisure. Not something you see in a downturn when people are hoarding money and penny pinching.
Below we have nearly a 1 to 1 correlation with highs and lows in ETH and JETS. JETS just made a 5 year breakout to new highs while ETH cratered. This is rare. The last time it happened was 2016. JETS is signaling that despite all the bearishness on the economy, airline earning are going up which means people are traveling more and more. This means they are feeling more confident in their future finances and willing to spend more money traveling. By the history of this chart it would appear when people have excess money to travel they also have excess money to invest and speculate on crypto.
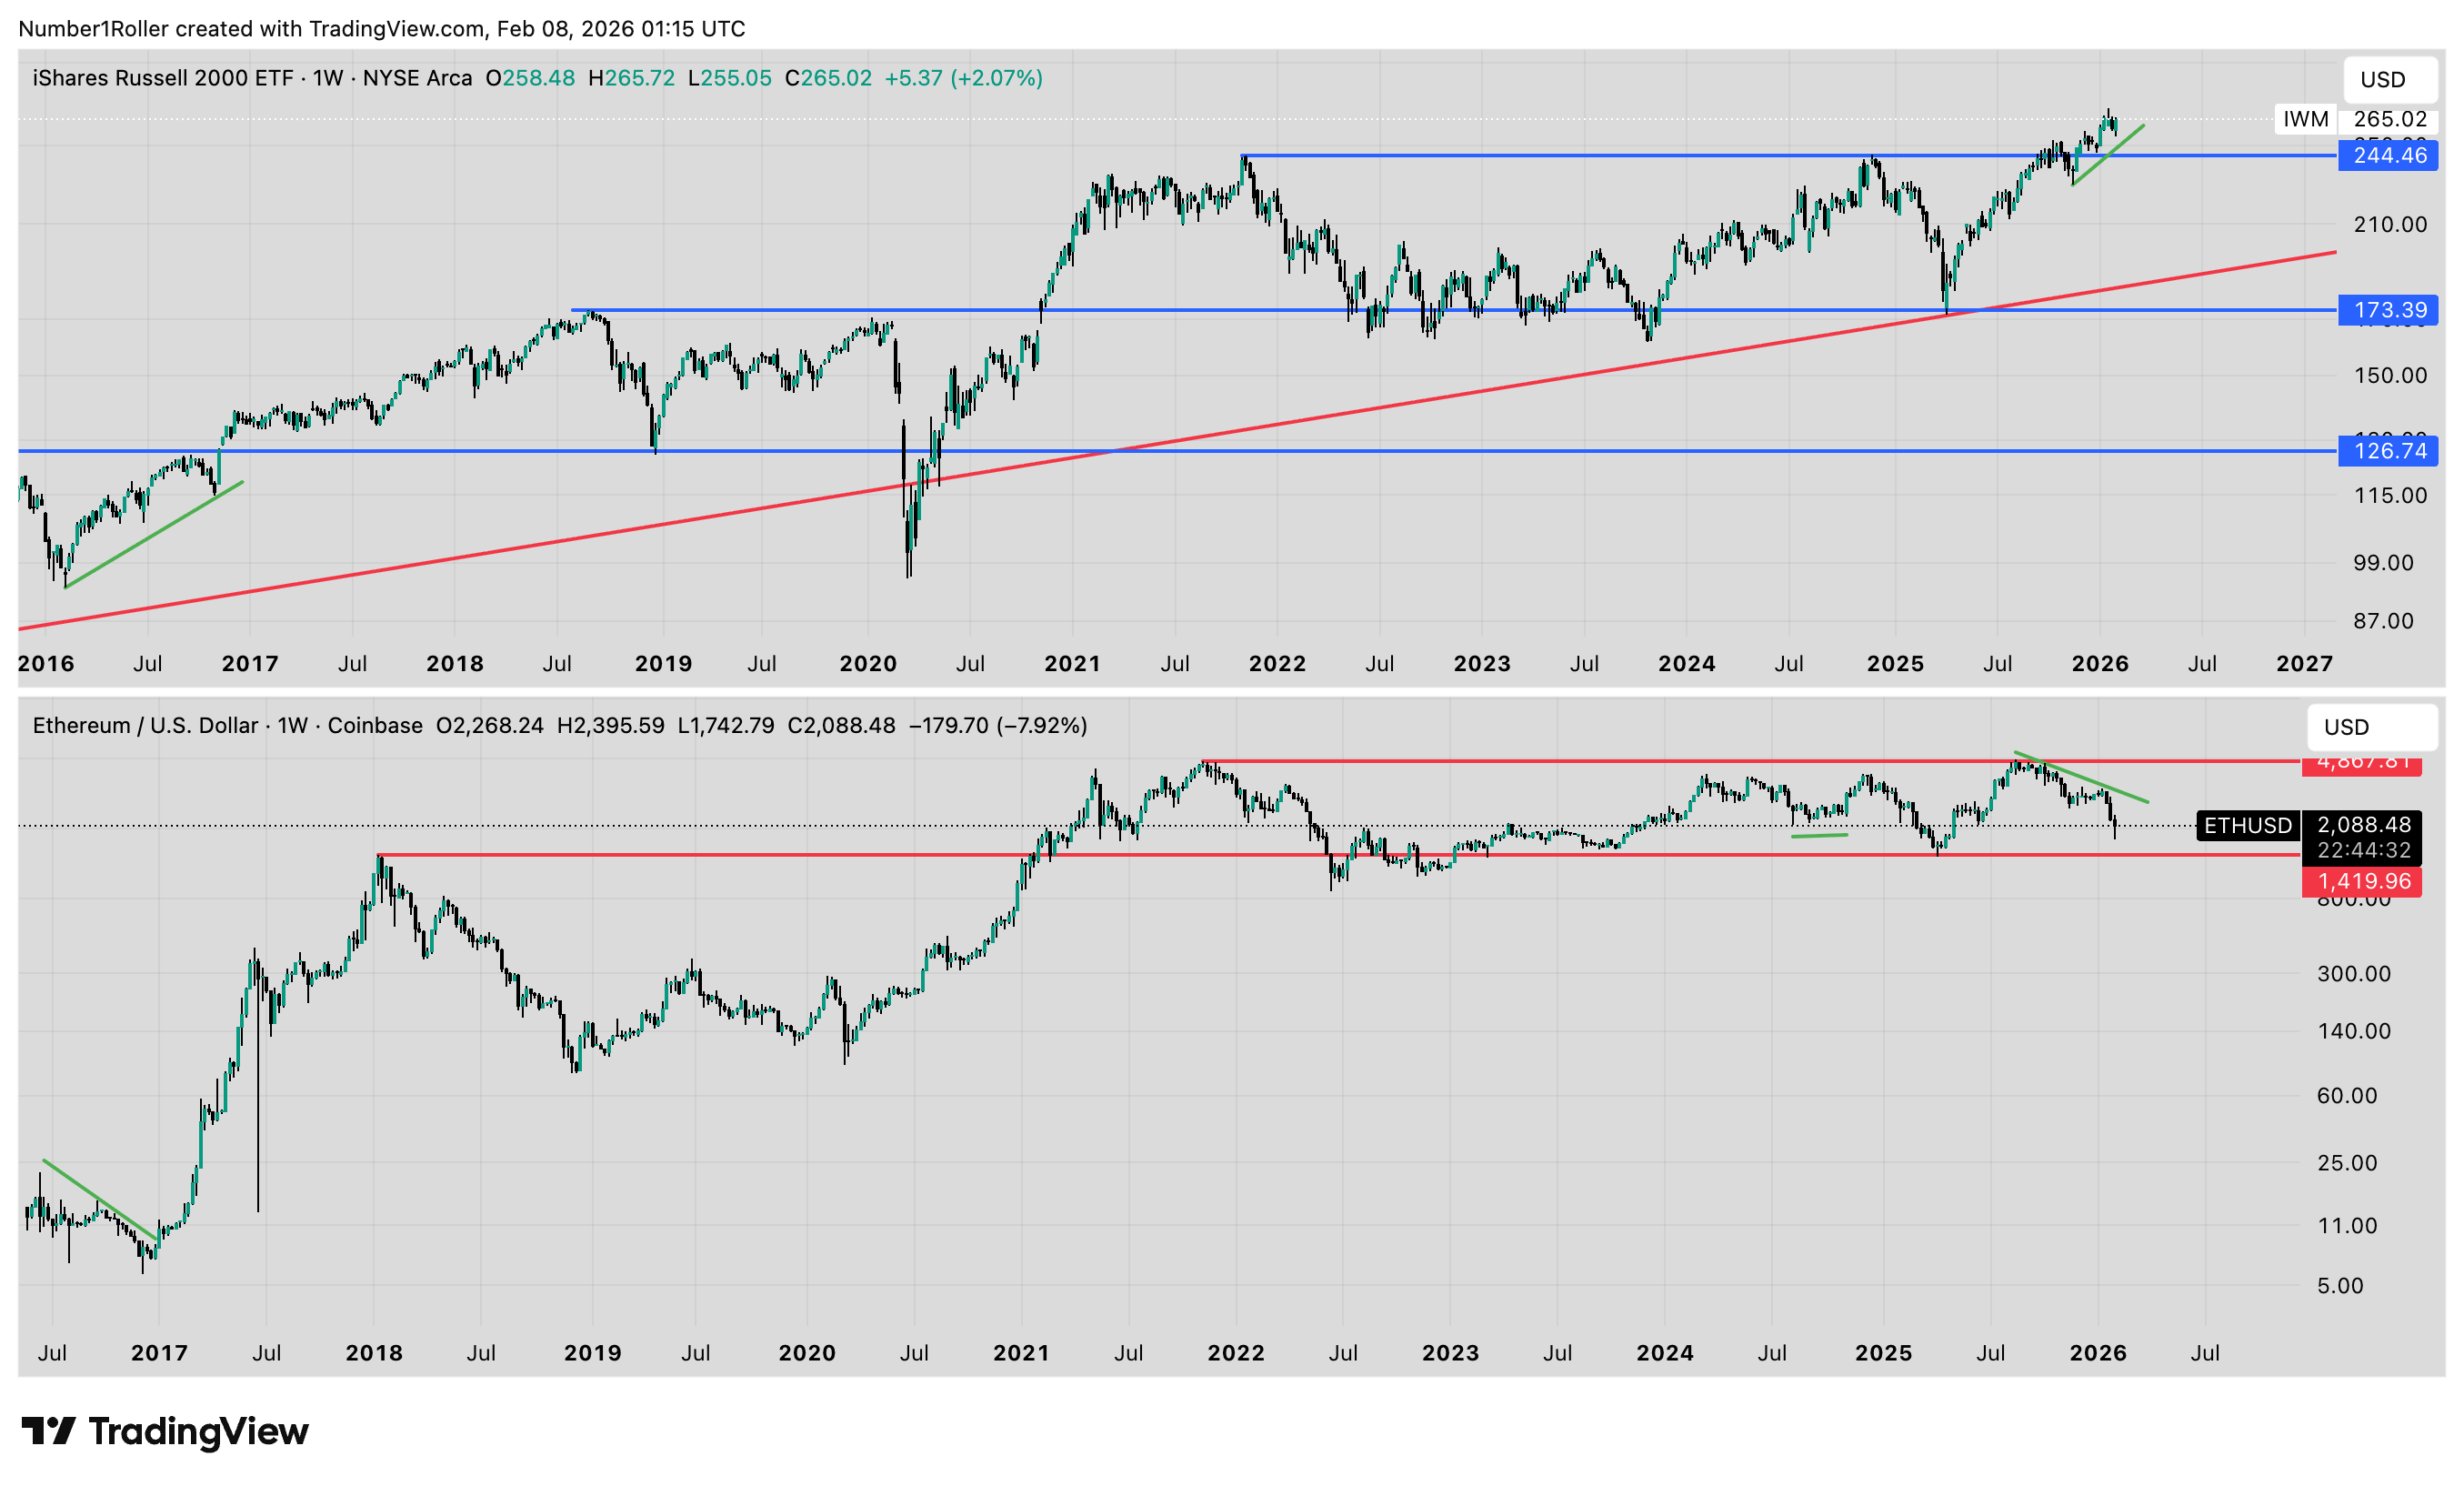
Small Caps Are Confirming the Rotation
Finally, just to really drive the point home lets look at the relationship with IWM. Overall, you have a very similar structural pattern in moves, yet not exactly the tightest relationship. That said, you can still see the last time we had this severe of a pullback in ETH while the IWM broke out was 2016.
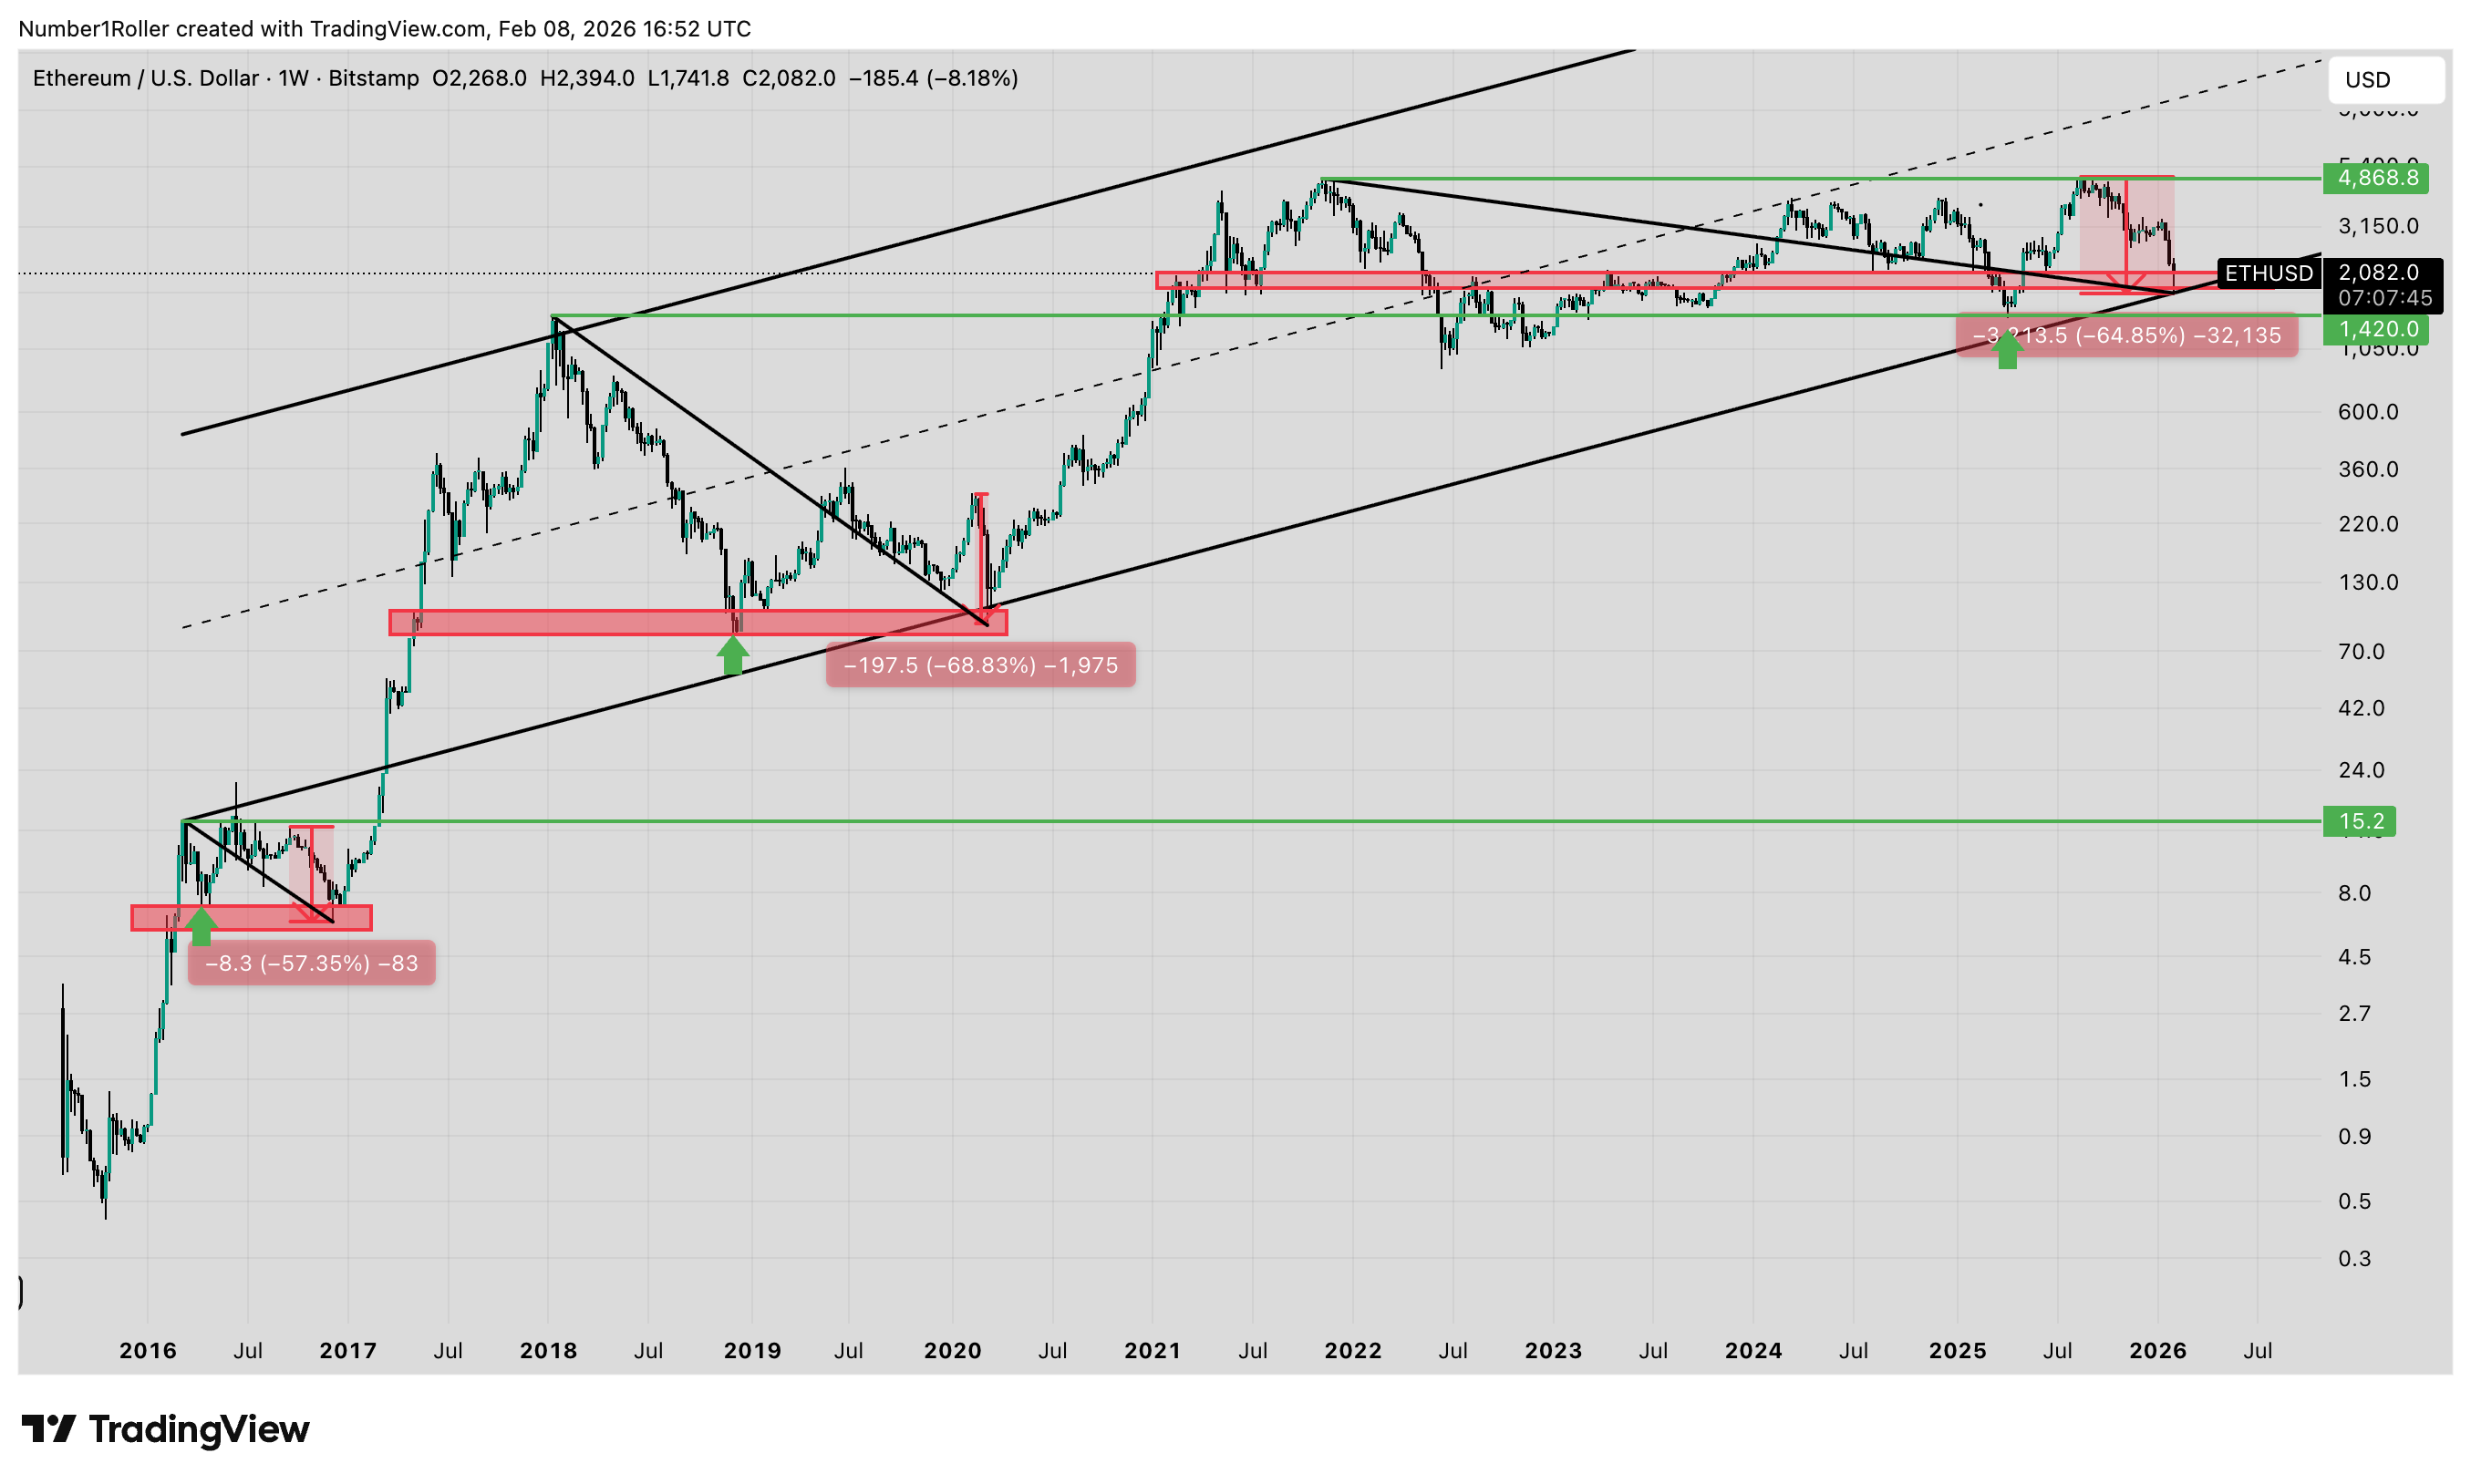
Ethereum at a Familiar Cycle Inflection
Wrapping up by just looking at the big picture structure of ETH we can see many similarities between this price movement and the movement around 2020 panic and 2016 bottom. Roughly 60% correction to a key cycle support zone and backtesting the breakout of a major trend line from previous cycle top all before the real fun began.
Conclusion: One of These is Not Like The Other
When you line up ETH against IWM, XLP, JETS, and the ISM, the conclusion becomes unavoidable: either every major macro signal is wrong at the same time, or ETH is doing exactly what it has done at prior inflection points—resetting, backtesting, and compressing before expansion.
Markets rarely send four independent confirmations in the same direction without resolution. History shows that when this kind of divergence appears, price eventually realigns with the broader cycle, not the other way around.
The evidence suggests ETH is likely to start playing catch up rather than fall into a bear market.
And when that snap back begins, it tends go faster and further than most are positioned for.