
Why the Four Year Cycle is Bullshit
Quite frankly I’ve seen enough about the 4 year cycle and its inspiring todays rant on why people who follow it will get totally blown out.
These people have never studied time or cycles in their life and yet they know for certain that the four year cycle is sure to complete. They have no idea what they are dealing with and will be forced to buy back into this market much much higher.
This is an argument based on pure data and not some random conjecture. I have simply had enough of the overwhelming bearishness and caution in the market and its forcing me to get very bullish.
I am not trying to inflate what this market will do but the sentiment alone is enough for me to say I’ve had it with the bullshit. We are going higher for longer than these people will be able to stay sane for.
Bull markets don’t make major tops when everyone is preparing to take profits and ride off into the sunset. They make major tops when people are scrambling to lever up and mortgage their house to buy more. They make major tops when your retarded friend/neighbor/cousin or uncle makes far more money than they have any business doing and proceeds to quit their job to become an investment professional. They make major tops when no one and I mean no one is bearish anymore.
We are a far cry from this scenario today where we have investors running to the exits anytime the SPX drops 3%. Or when the entire crypto world is planning to sell in the next three months because of some cycle which they arbitrarily made up and have no significant data to back up whatsoever.
What these new cycles experts fail to realize is that a cycle is only as good as the underlying conditions it’s built on.
The map is not the territory is a saying that comes to mind here.
What that means is that you can look at a map all you want but that will only give you a rough idea of where you are. What a map wont show is the hole in the ground 300 ft to your left. Or the massive oak tree standing in the middle of the field. Or the abandon shed 1 mile ahead of you. And it certainly wont tell you that its 110 degrees outside with 50% humidity. Or whether or not your in the jungle or on a deciduous forrest.
The idea is that the map will show the coordinates and direction of your whereabouts but it gives you no sense of the actual objects, whether, and terrain you may be navigating.
Cycles are the map they give us time frames and historical data of what we generally expect to see but the conditions underlying the market are the territory.
It’s the conditions that drive the cycle to be bigger, smaller, more volatile, less volatile and so on.
The cycle we are in today is inherently different from the last three cycles in terms of conditions and we are going to break down why exactly that is and how it shows up in the charts. There is a key distinction here between the saying “this time is different” and the saying “same same but different.”
Price Structure and Behavior
Right off the bat from this cycle we can clearly tell that the structure and behavior of the market is different than previous cycles. The reason being that new assets and markets go through different phases of growth and adoption. This reminds me of Peter Lynchs idea of companies changing styles over time.
Companies are not always going to be high growth companies. Over time they change into lower growth but become stalwarts in the business.
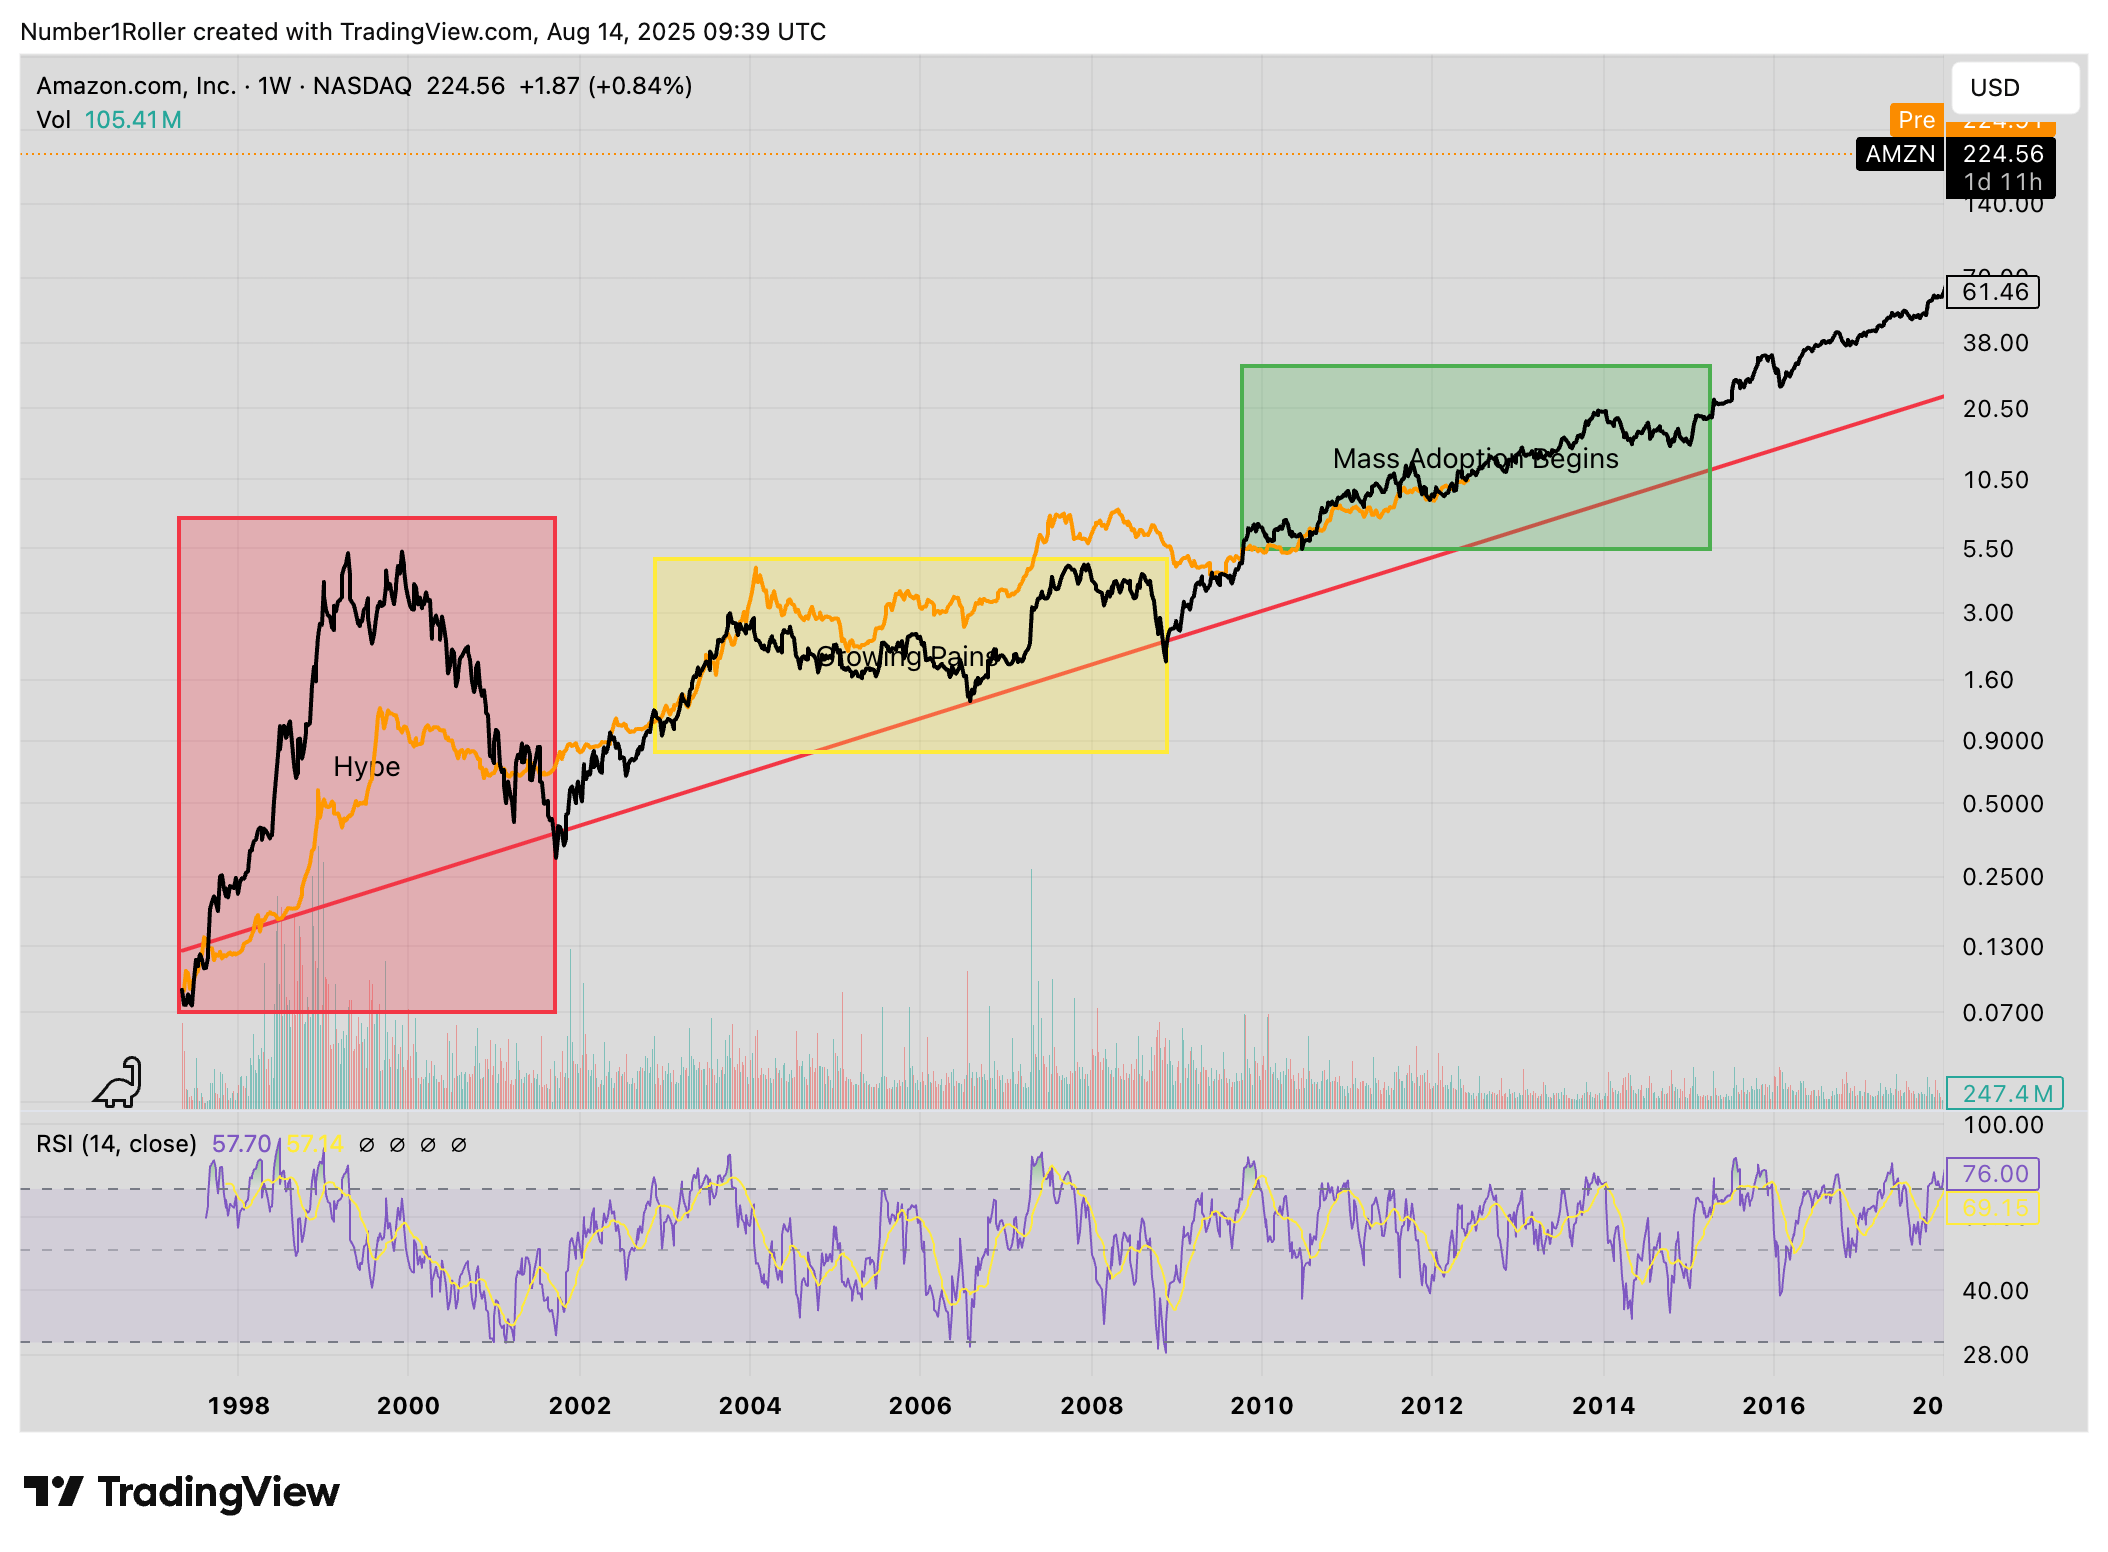
This is a typical adoption cycle where the first cycle is one of hype, the second cycle is one of growing pains and uncertainty and the final phase is where mass adoption begins and the early majority take over.
Lets look at the case of Amazon its lifecycle and market structure and compare it to BTC and ETH
Similarly ETH is shown below

This is an argument we made months ago during the Q1 crash in markets. (One of our most popular articles you can read here)
We demonstrated the close relationship to what we see here in this AMZN structure and behavior to what we are currently witnessing in the major cryptos.
Clearly the early 2017 cycle was driven by a lot of hype similar to AMZN in 1999. Then we have the 2021 bull market really representing sort of a sideways move in structure more so than a big expansion. It was a critical proving ground for the asset to survive the 2020 crash and the 2022 bear market to say is this thing the real deal or not?
Similarly AMZN never made a new all time high until after 2008. It was a long fight to prove that they survived the internet bust and could really create a long term viable business.
And finally, we reach the mass adoption phase where the early majority start to get on board. This was the final hurdle for BTC and crypto as an asset. The final argument anyone ever had which was “what if the government bans it?” has been put to rest. Not only is the government not banning it, they are bending over backwards to embrace it. This is textbook adoption curve stuff.
Okay that’s great we know we are in the mass adoption phase but what does this have to do with the four year cycle?
DOW
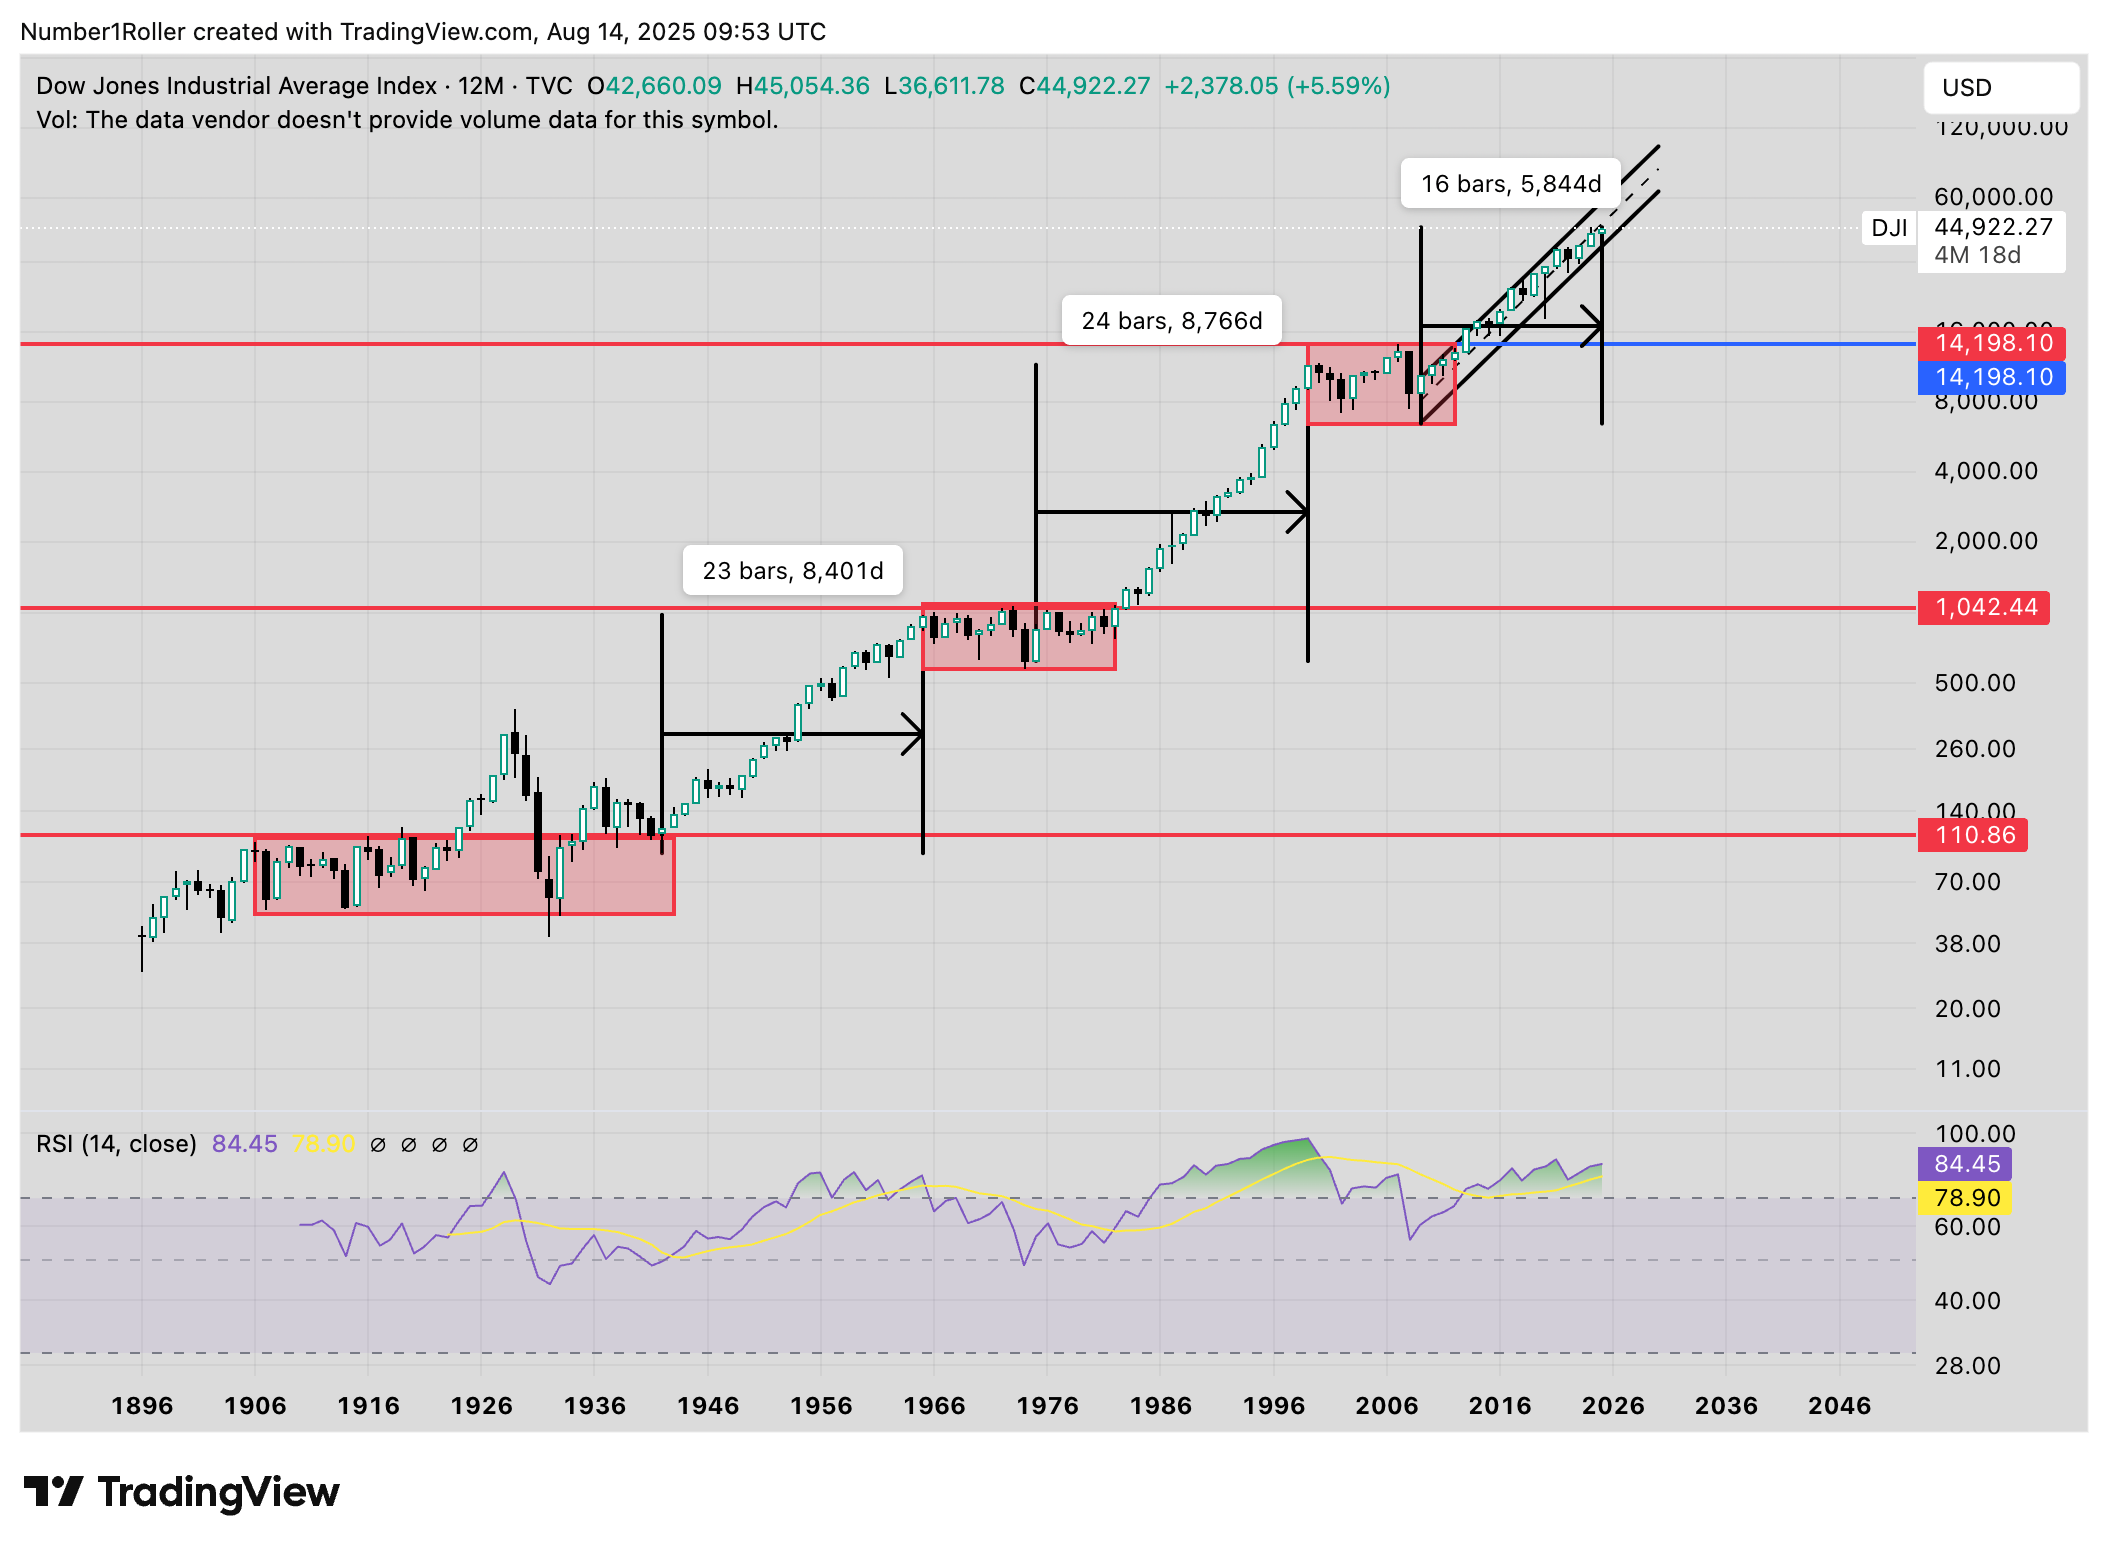
Let’s take a step back and look at the DOW. The DOW is hands down the favorite chart of any serious analyst because the price history goes all the way back to 1896 on Trading View. With over 100 years of data its the best data set we have to go off of.
Taking a step back and looking at the 1 year chart we can see that 3 times in the history of the DJI it has had consolidations lasting over a decade. After each of the previous two consolidations it expanded for roughly 17-23 years. The most recent consolidation was 2000-2013. We are currently only 16 years into this move which would be the shortest in history if this were to be the top.
If we take a closer look at this current 16 year bull market from the 2008 bottom we can see that on four occasions it has retested the previous tops.
The 2015 bottom was a retest of 2008 top. 2020 bottom was a retest of 2015 top. 2022 bottom was a retest of 2020 top. And the most recent April bottom was a retest of the 2022 top.
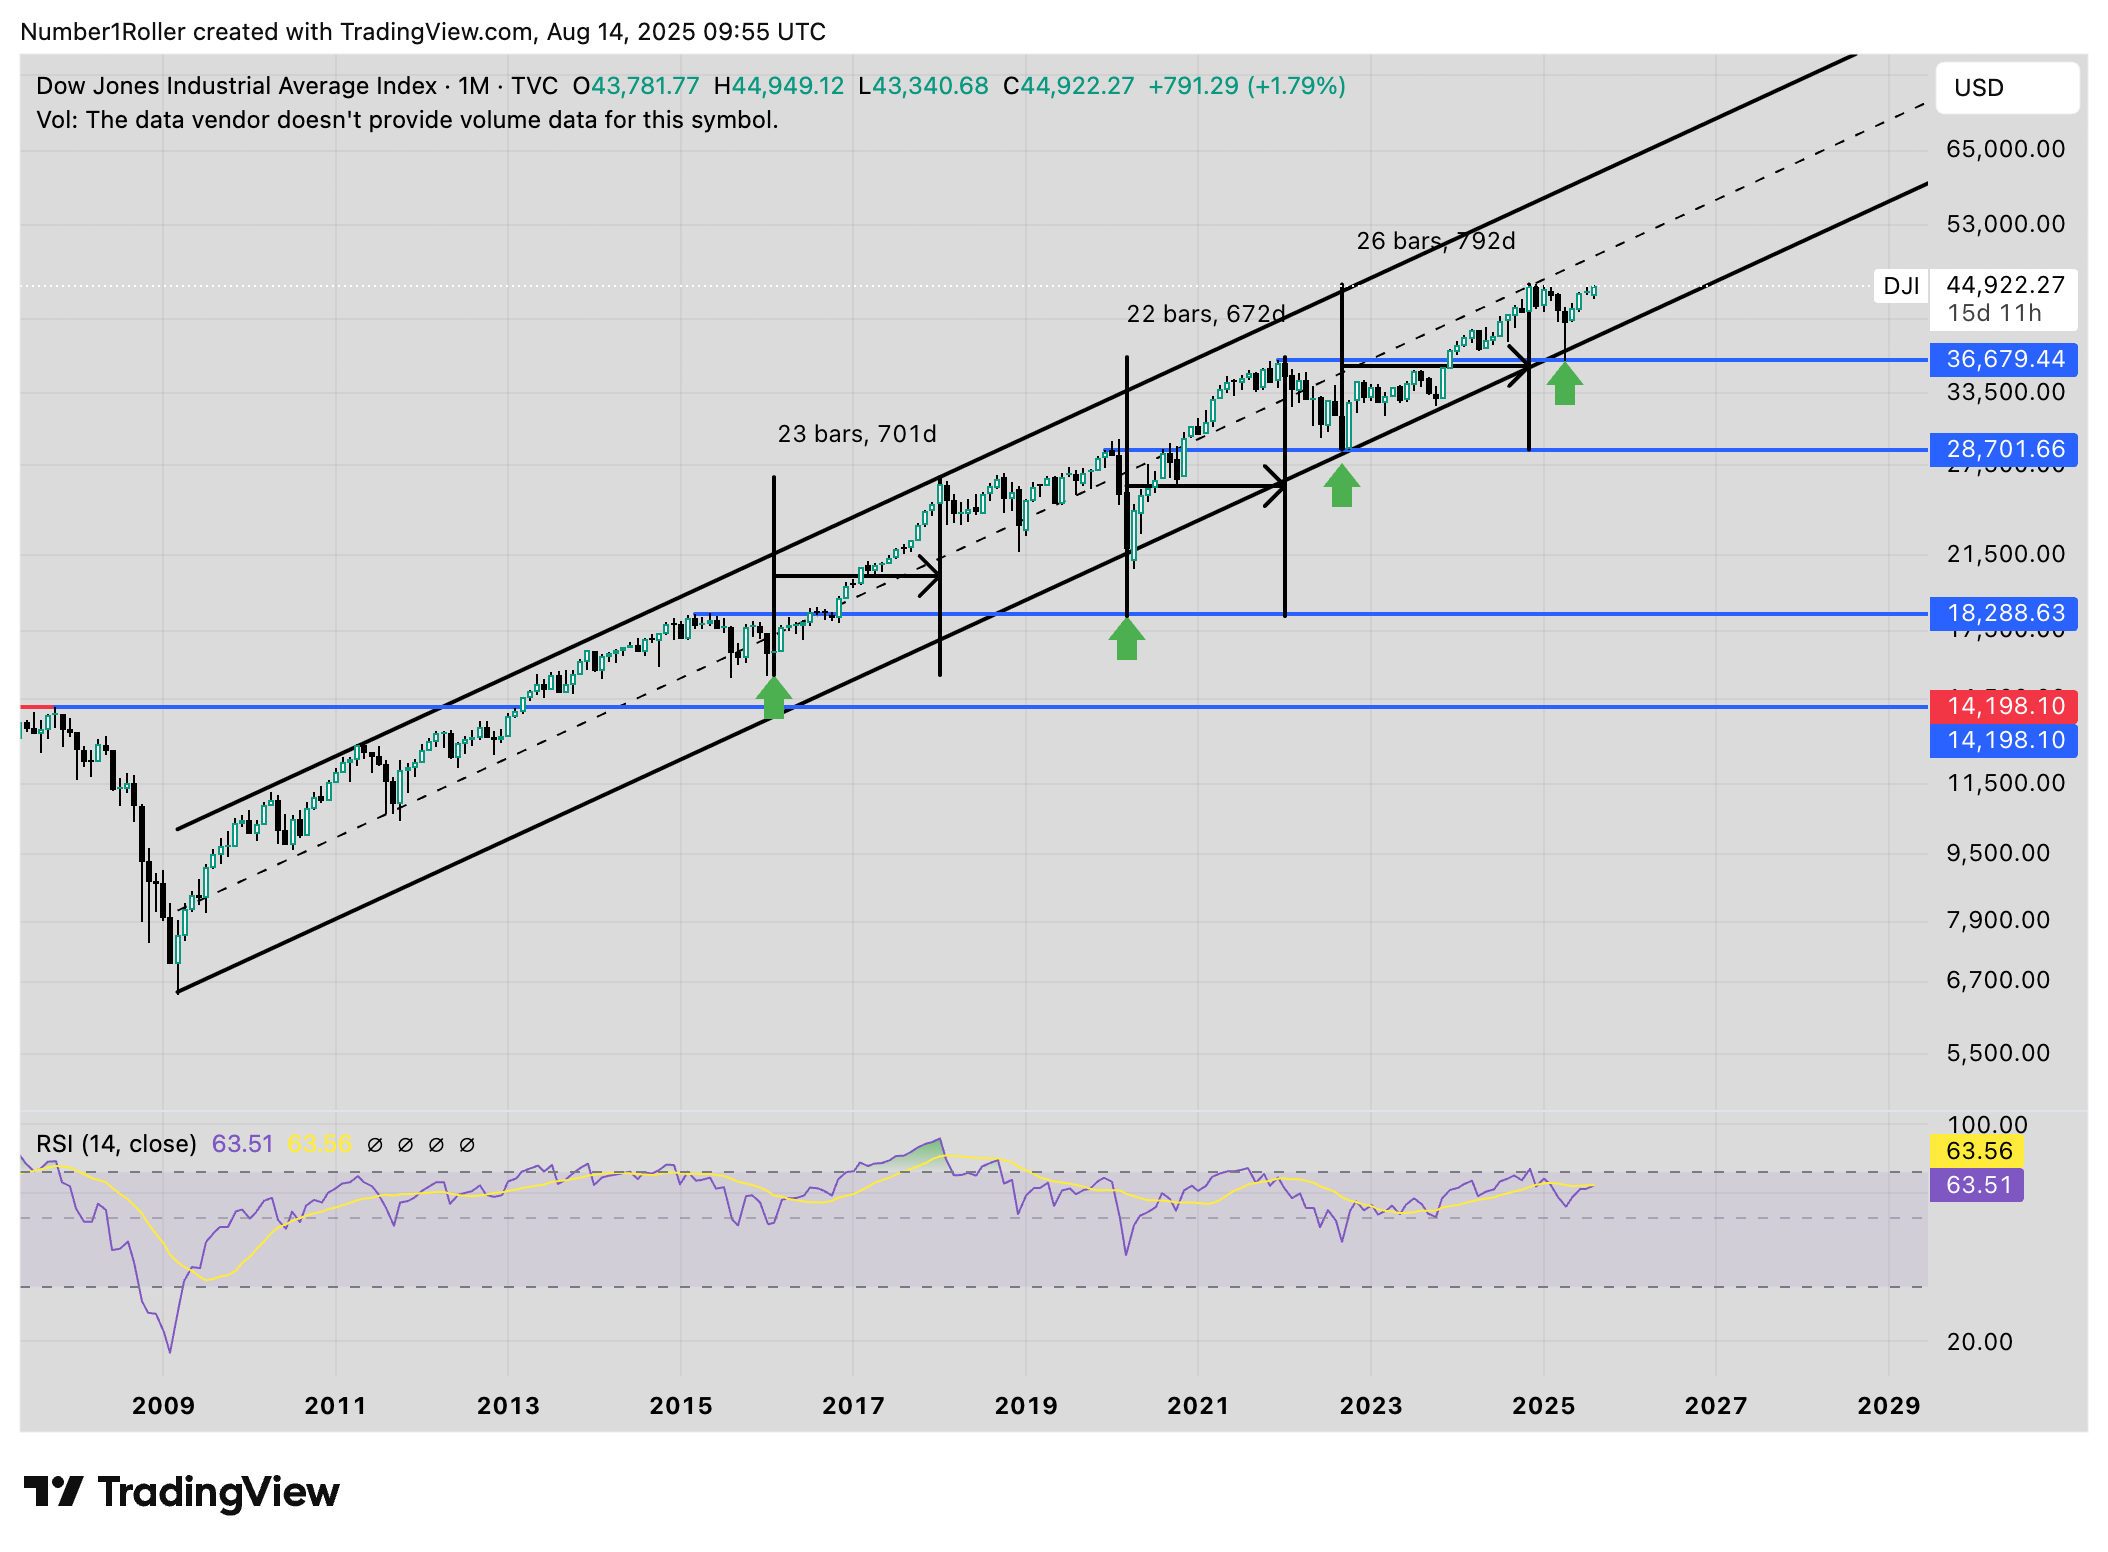
Like clockwork the market continues turning old tops into support while climbing this bullish channel. The key takeaway though is the time that the market runs up after each retest. You can see above that the minimum run was 22 months of upside. Currently, we are only five months into this move off the April low. A 22 month rally at minimum would put us into early 2027.
This is just another great data point to show you why I’m bullish on markets as a whole for at least the next 12 months. I find it hard to believe cryptos would crash in this environment while equities continue to pile on gains.
Bull to Bear and Back
Another reason I have to believe this bull market is just getting started is due to the April crash.
I don’t think people are giving that crash enough credit for just how much fear it put into the market both in stocks and cryptos. We are talking about sentiment, time, and price that was on serious bear market levels.
The readings we were seeing were on par with oversold levels and fear levels of 2020, 2008, and 2000. Complete market wipeouts.
What that did is actually give this market the fuel it needed to start a new phase of the bull that is going to go longer and stronger than anyone is ready for.
Just look at ETH here. The ETH wipeout went down longer than the FTX collapse and nearly the same magnitude in price. In my view it was the completion of a bear market that started at that 2024 market top. We made a triple top with that final November exit pump and a 50 plus week bear market completed with that crash.
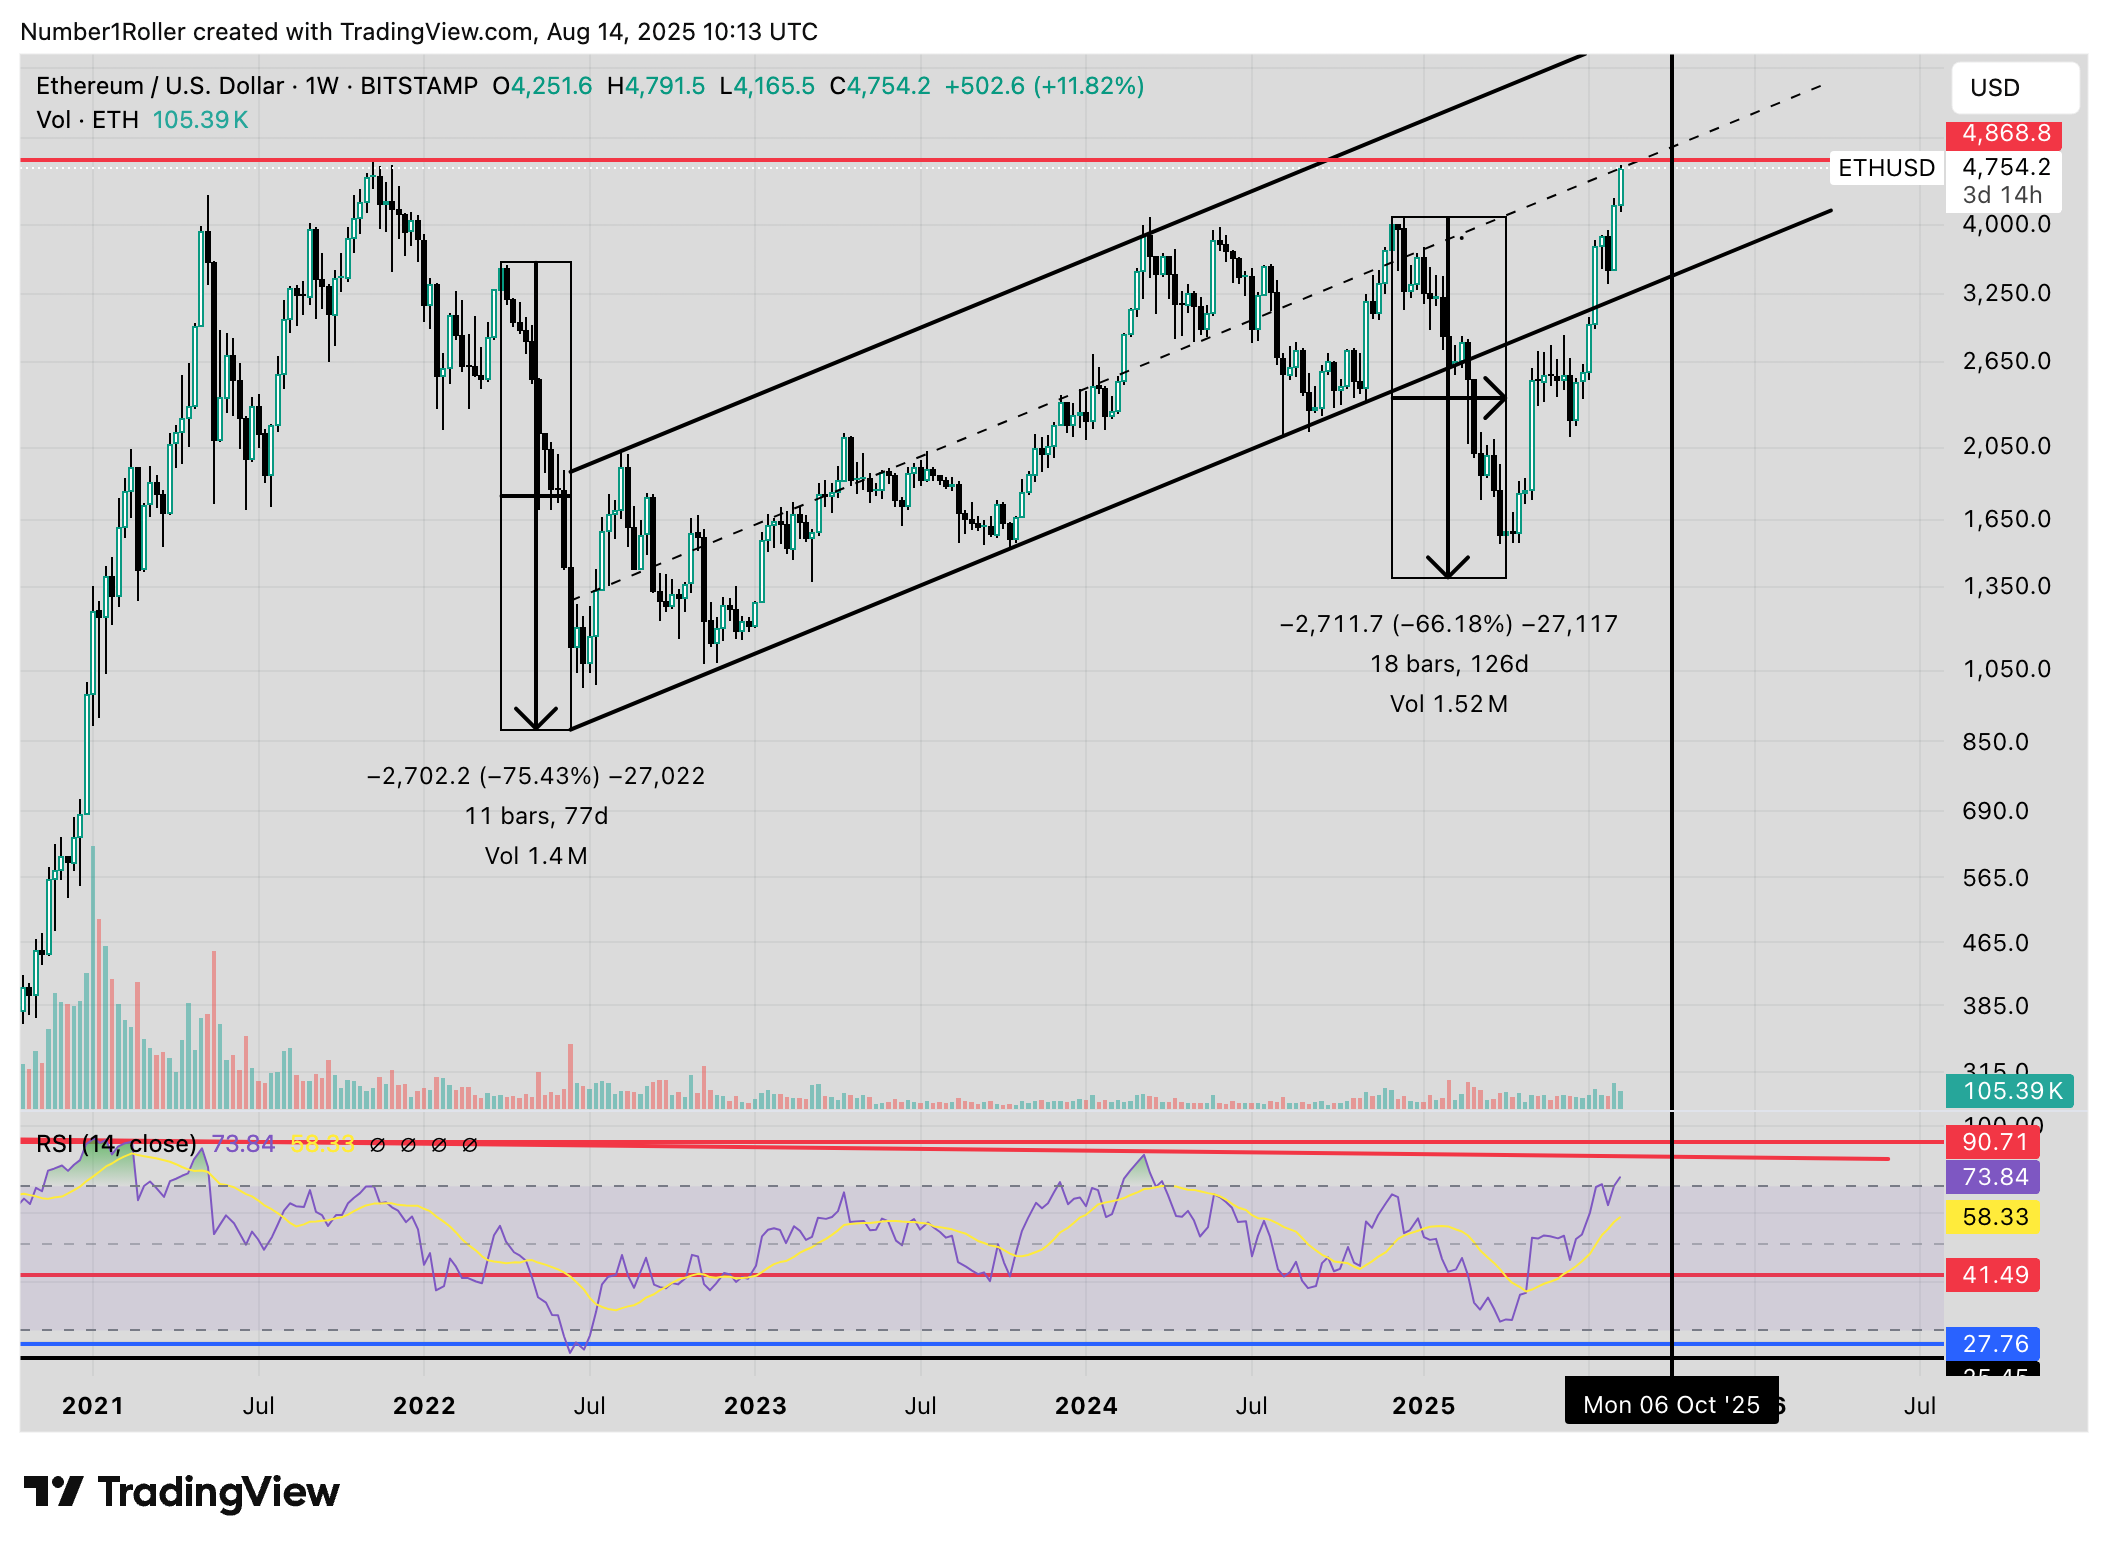
The reason to back this up is because we actually had a full bull market already on ETH. Check out these time ranges here. Typical bull markets run anywhere from 90 to 120 weeks. Subscribers know the significance of those time factors.
Interestingly enough the exact time from the 2022 bottom to the early 2024 top was 90 weeks. In other words I believe that was quietly a full cycle that completed there followed by a bear cycle which lasted exactly one year from that top (similar to other bear markets) and culminated in a crash in April.
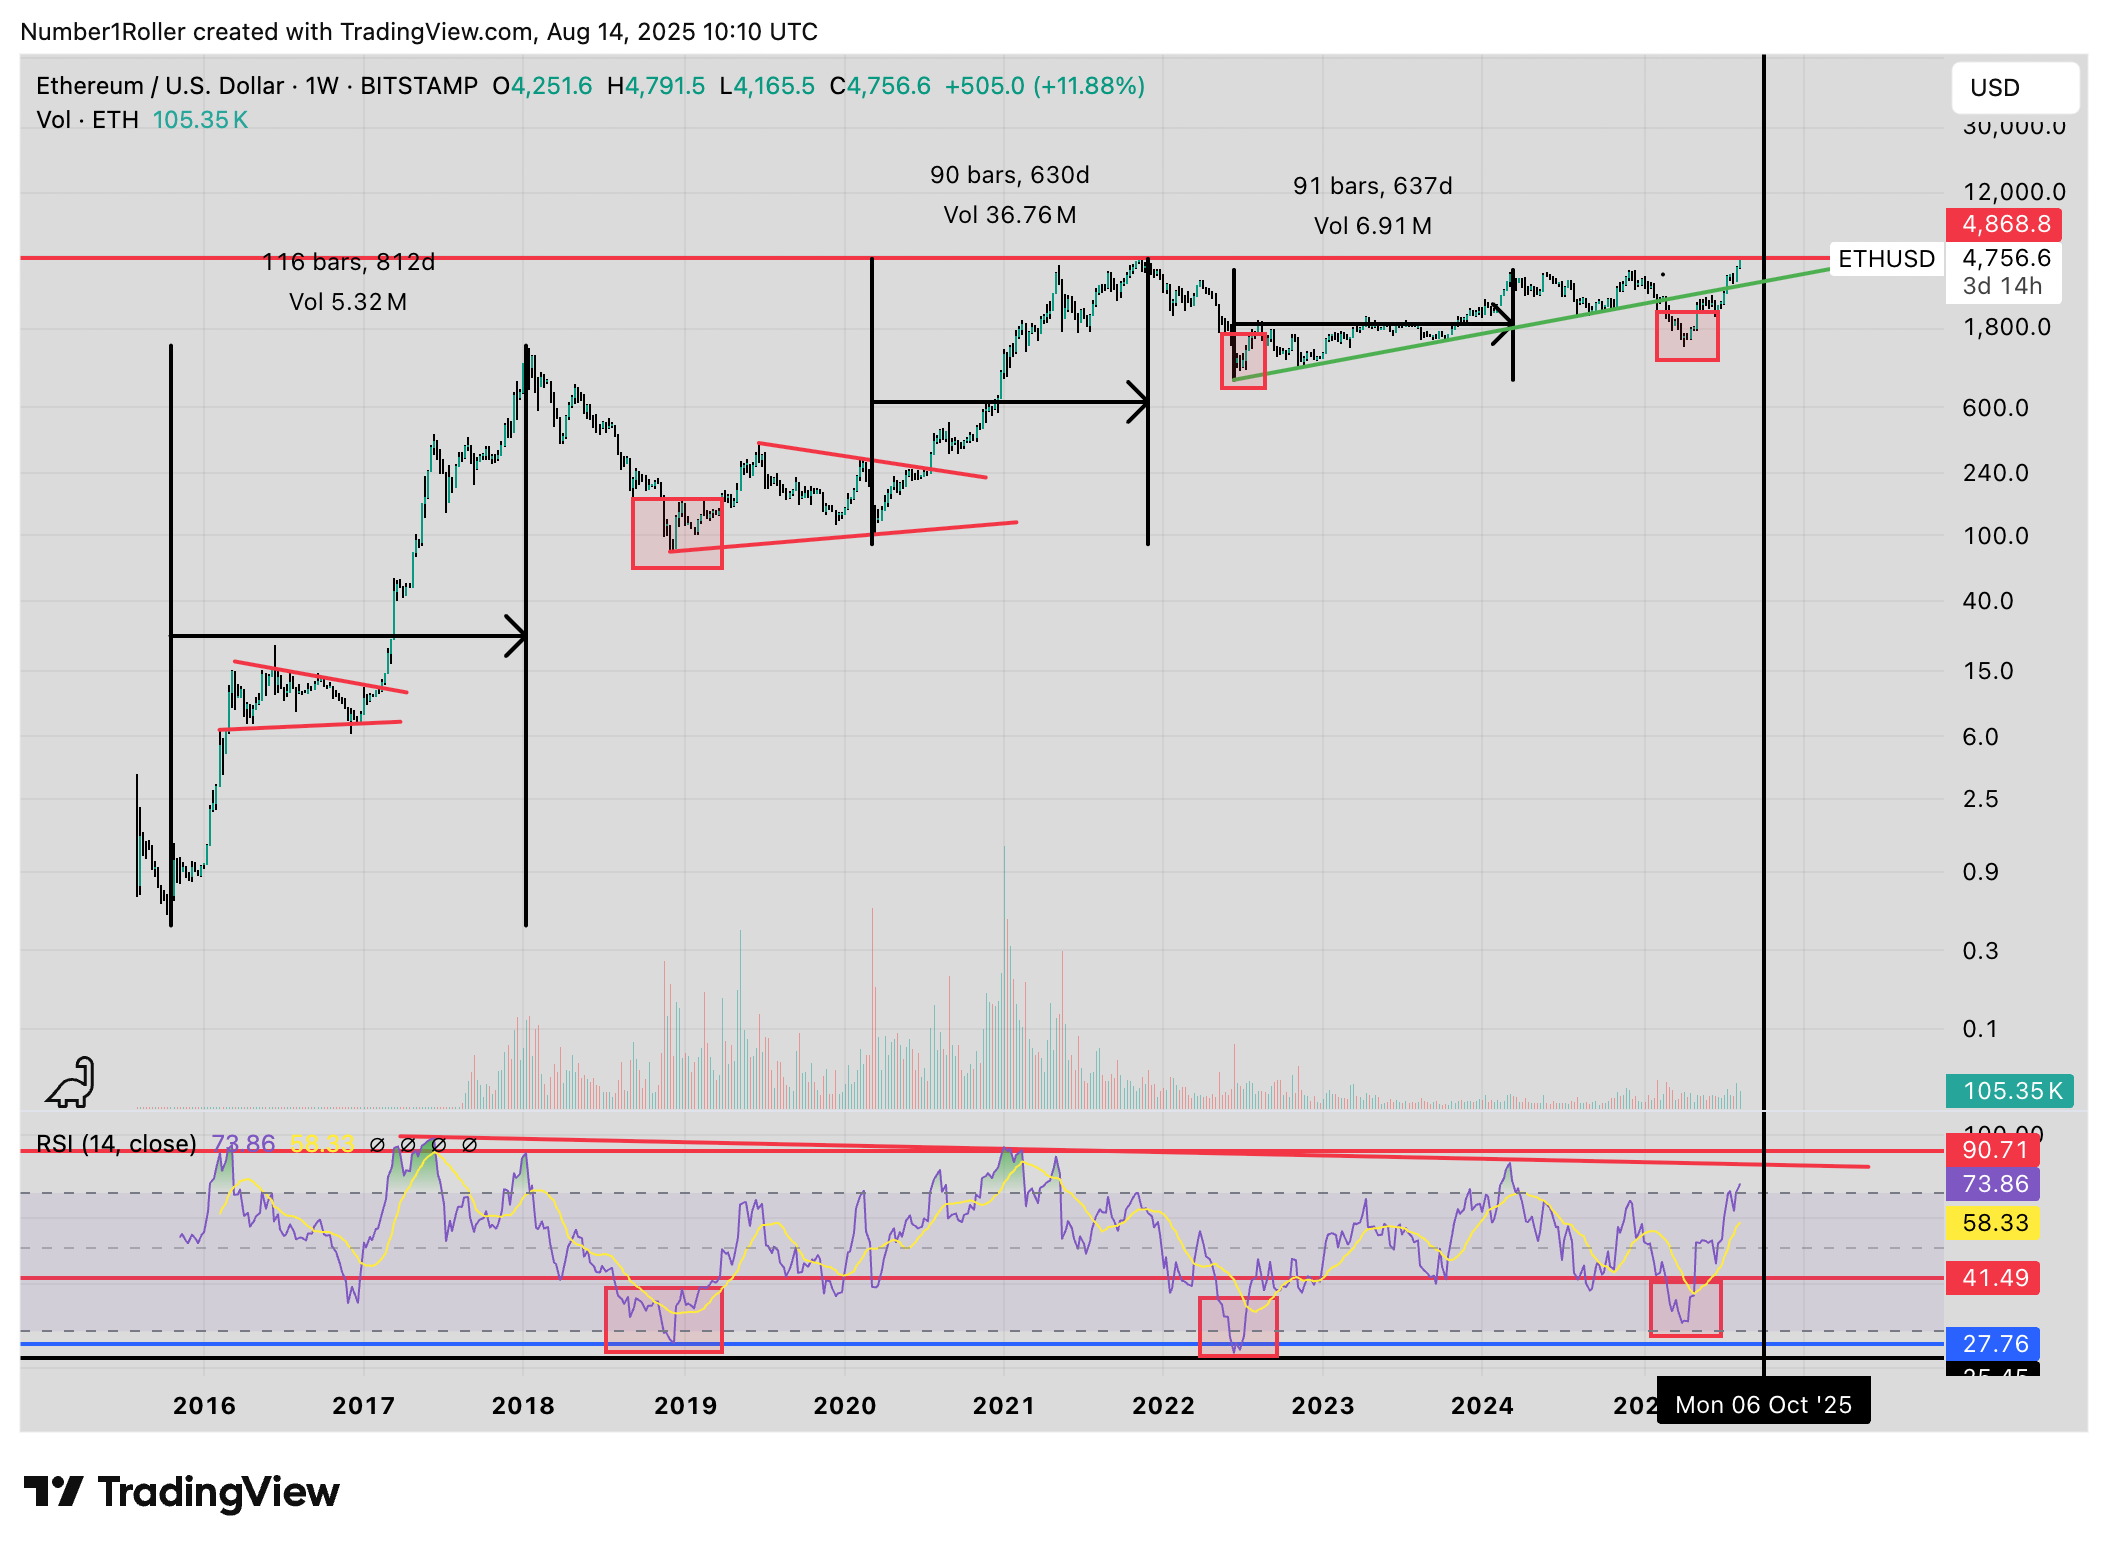
Just look at the RSI readings on the chart above. Only three times did the weekly RSI read at these levels and all three occasions were bear market bottoms. The April low was the equivalent of a bear market bottom and gives us plenty of runway ahead.
Copper/Gold Ratio
This is a great visual of market correlations that was brought to me by Bravos Research.
It’s the Copper top Gold ratio chart and its been calling out the parabolic moves and cycle tops on BTC since 2013.
Each time this chart bottoms and moves up BTC begins its most aggressive expansion. Subsequently, when it tops BTC has also consitently topped.

I find this chart very interesting for two reasons. Other than the correlation which is as clear as any that I have seen, the time aspect is very interesting. This chart is right at its lows now and assuming it’s bottoming the typical bull cycle is 17 months.
17 months from today gets us all the way into early 2027 which is on par with what I just showed you in the DOW.
Not only does it go up for 17 months but it coincides with the biggest part of the BTC bull run which according to this hasn’t even started yet.
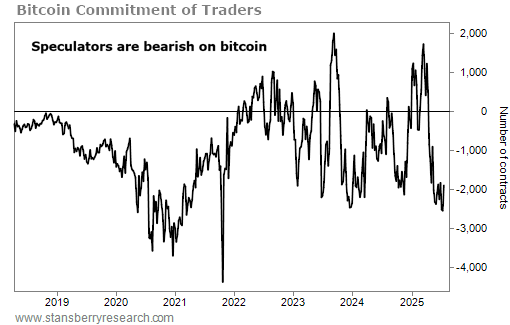
On a side note to that I want to show you this stat from our friends at Stansberry Research highlighting the short position on BTC by the commitment of traders.
Currently we are at the highest level of bearishness since 2021.
Stansberry went on to show that anytime the COT reached a new extreme 1yr level of bearishness the following price action occurred.
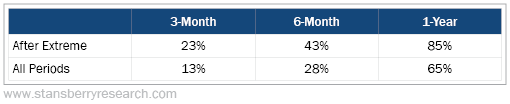
This is only 6 years of data but that would suggest BTC could surge to 230k by this time next year which again would mean a longer cycle based off this extreme reading.
ALTS
Next we have ALTS. I don’t have much to say about alts other than the prospects of a massive alt season are very promising. However, big market moves take time and as you will see the four year cycle has to be nonsense if these move are going to have time to complete.
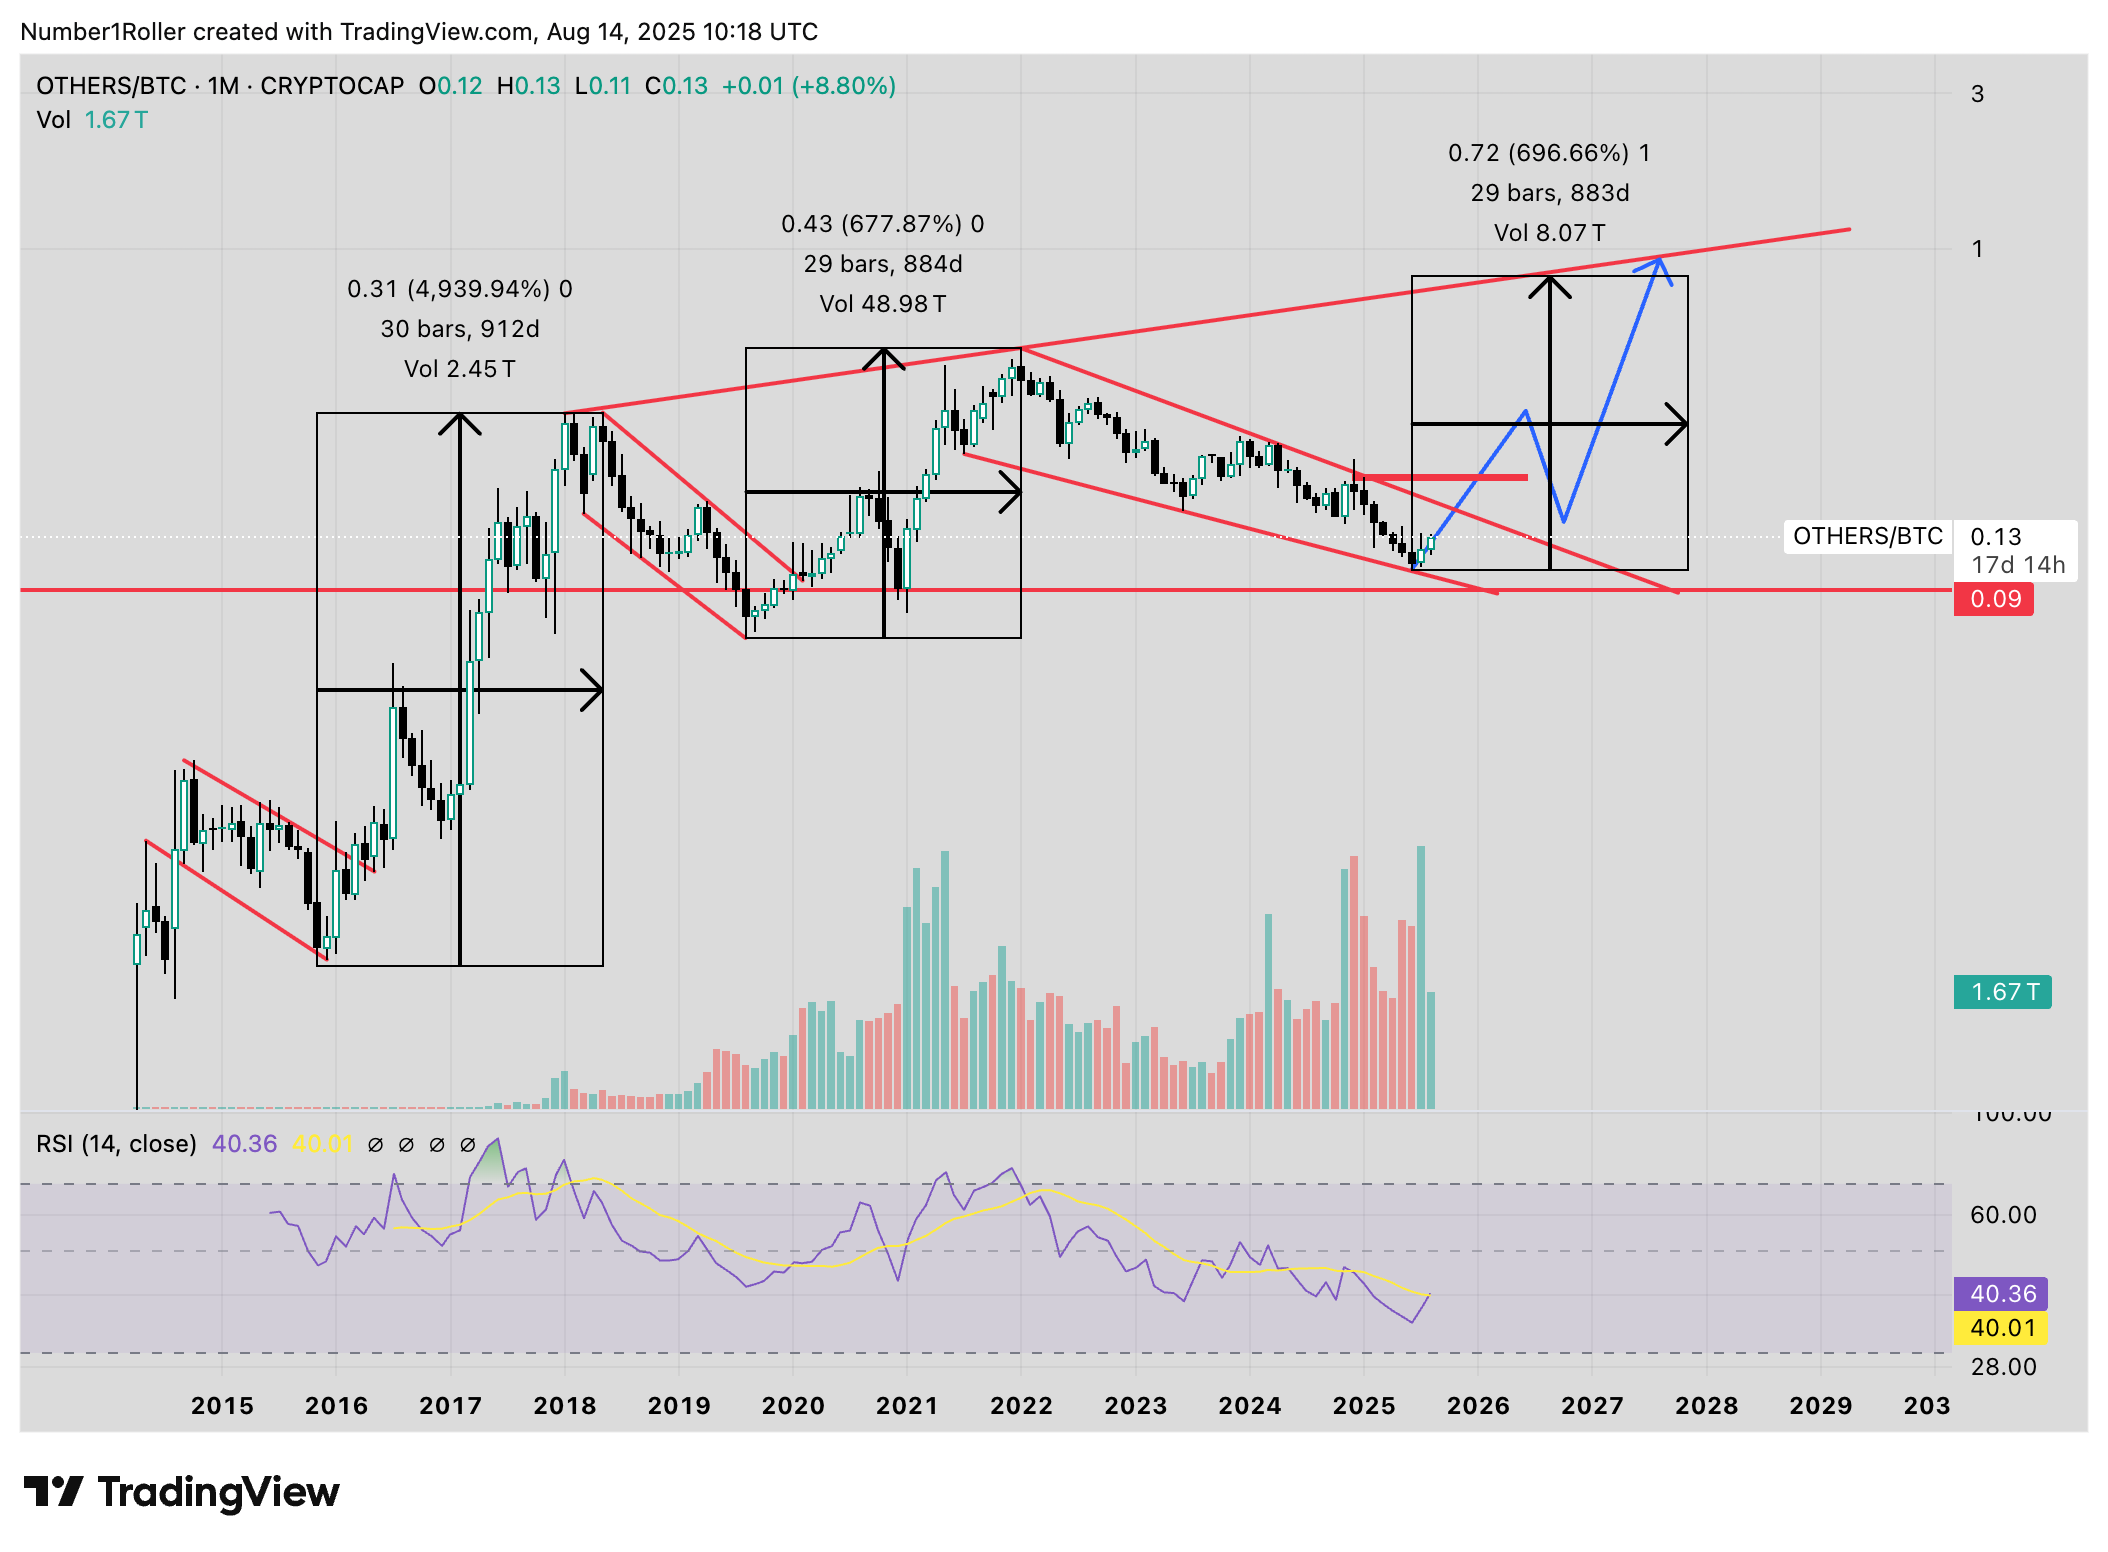
Looking at the below OTHERS chart you cant call yourself any kind of analyst if you think this is in any way bearish. This structure alone is all you have to see to get extremely bullish on ALTS.
Furthermore, we know that the longer a market takes to cross old tops, the larger the move will be.
When this breaks out there is no telling how high it will go but I very seriously doubt it only goes up for 8 weeks after what has been a nearly 5 year build up.
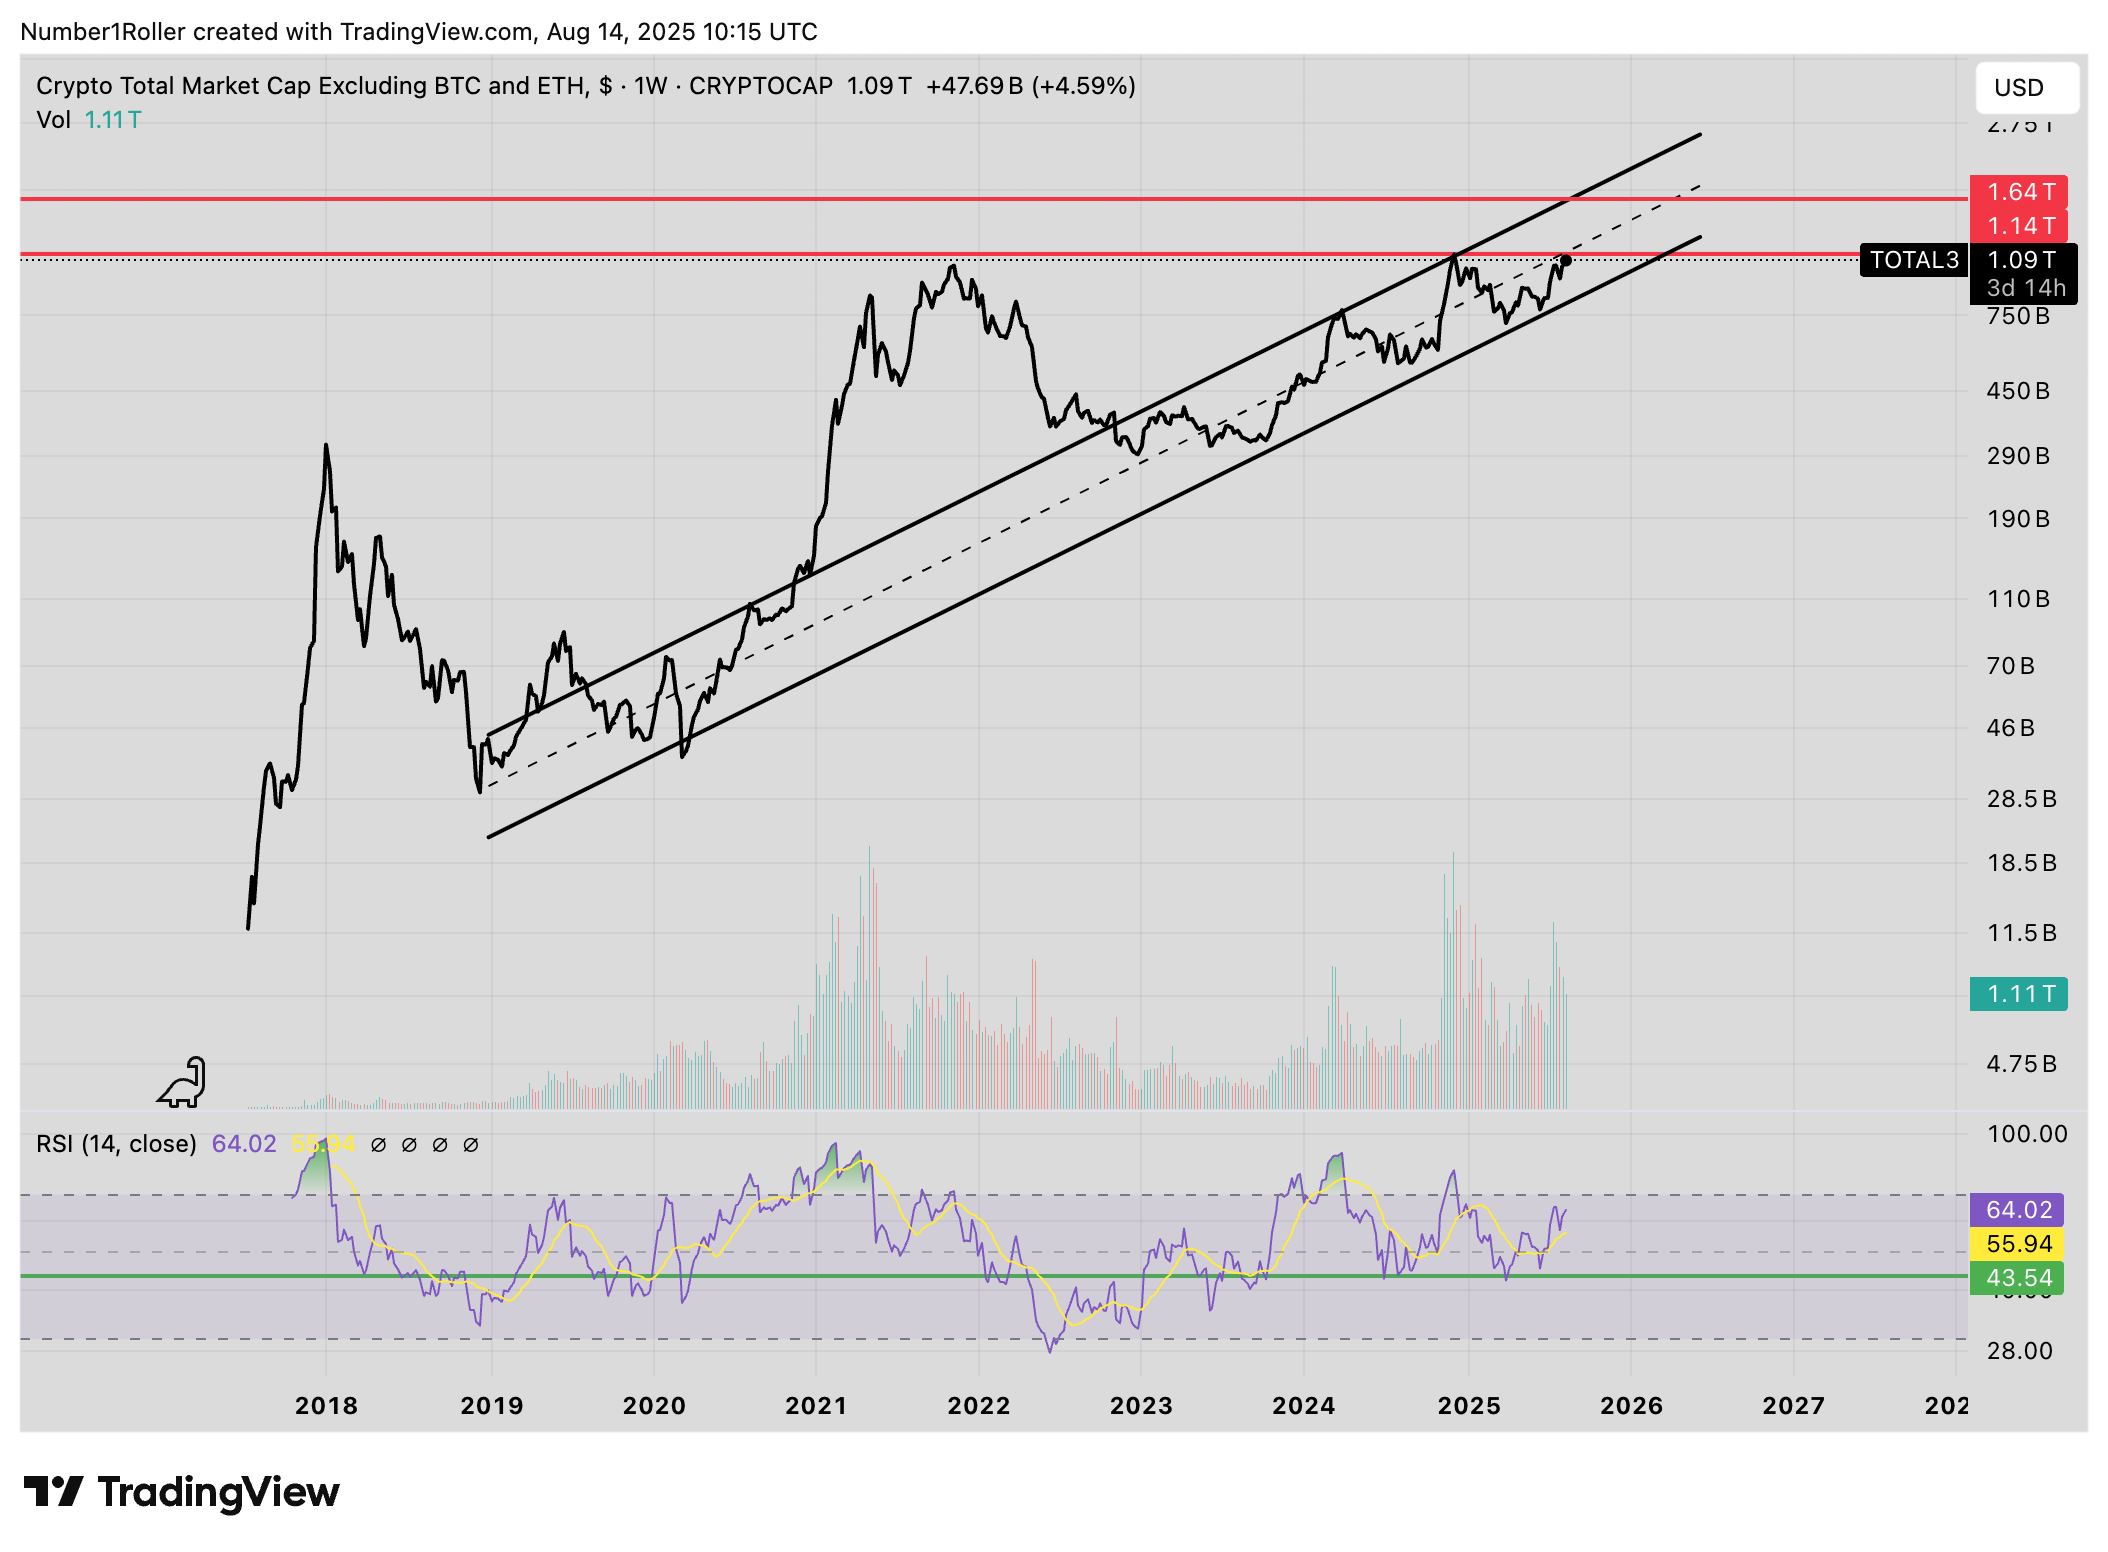
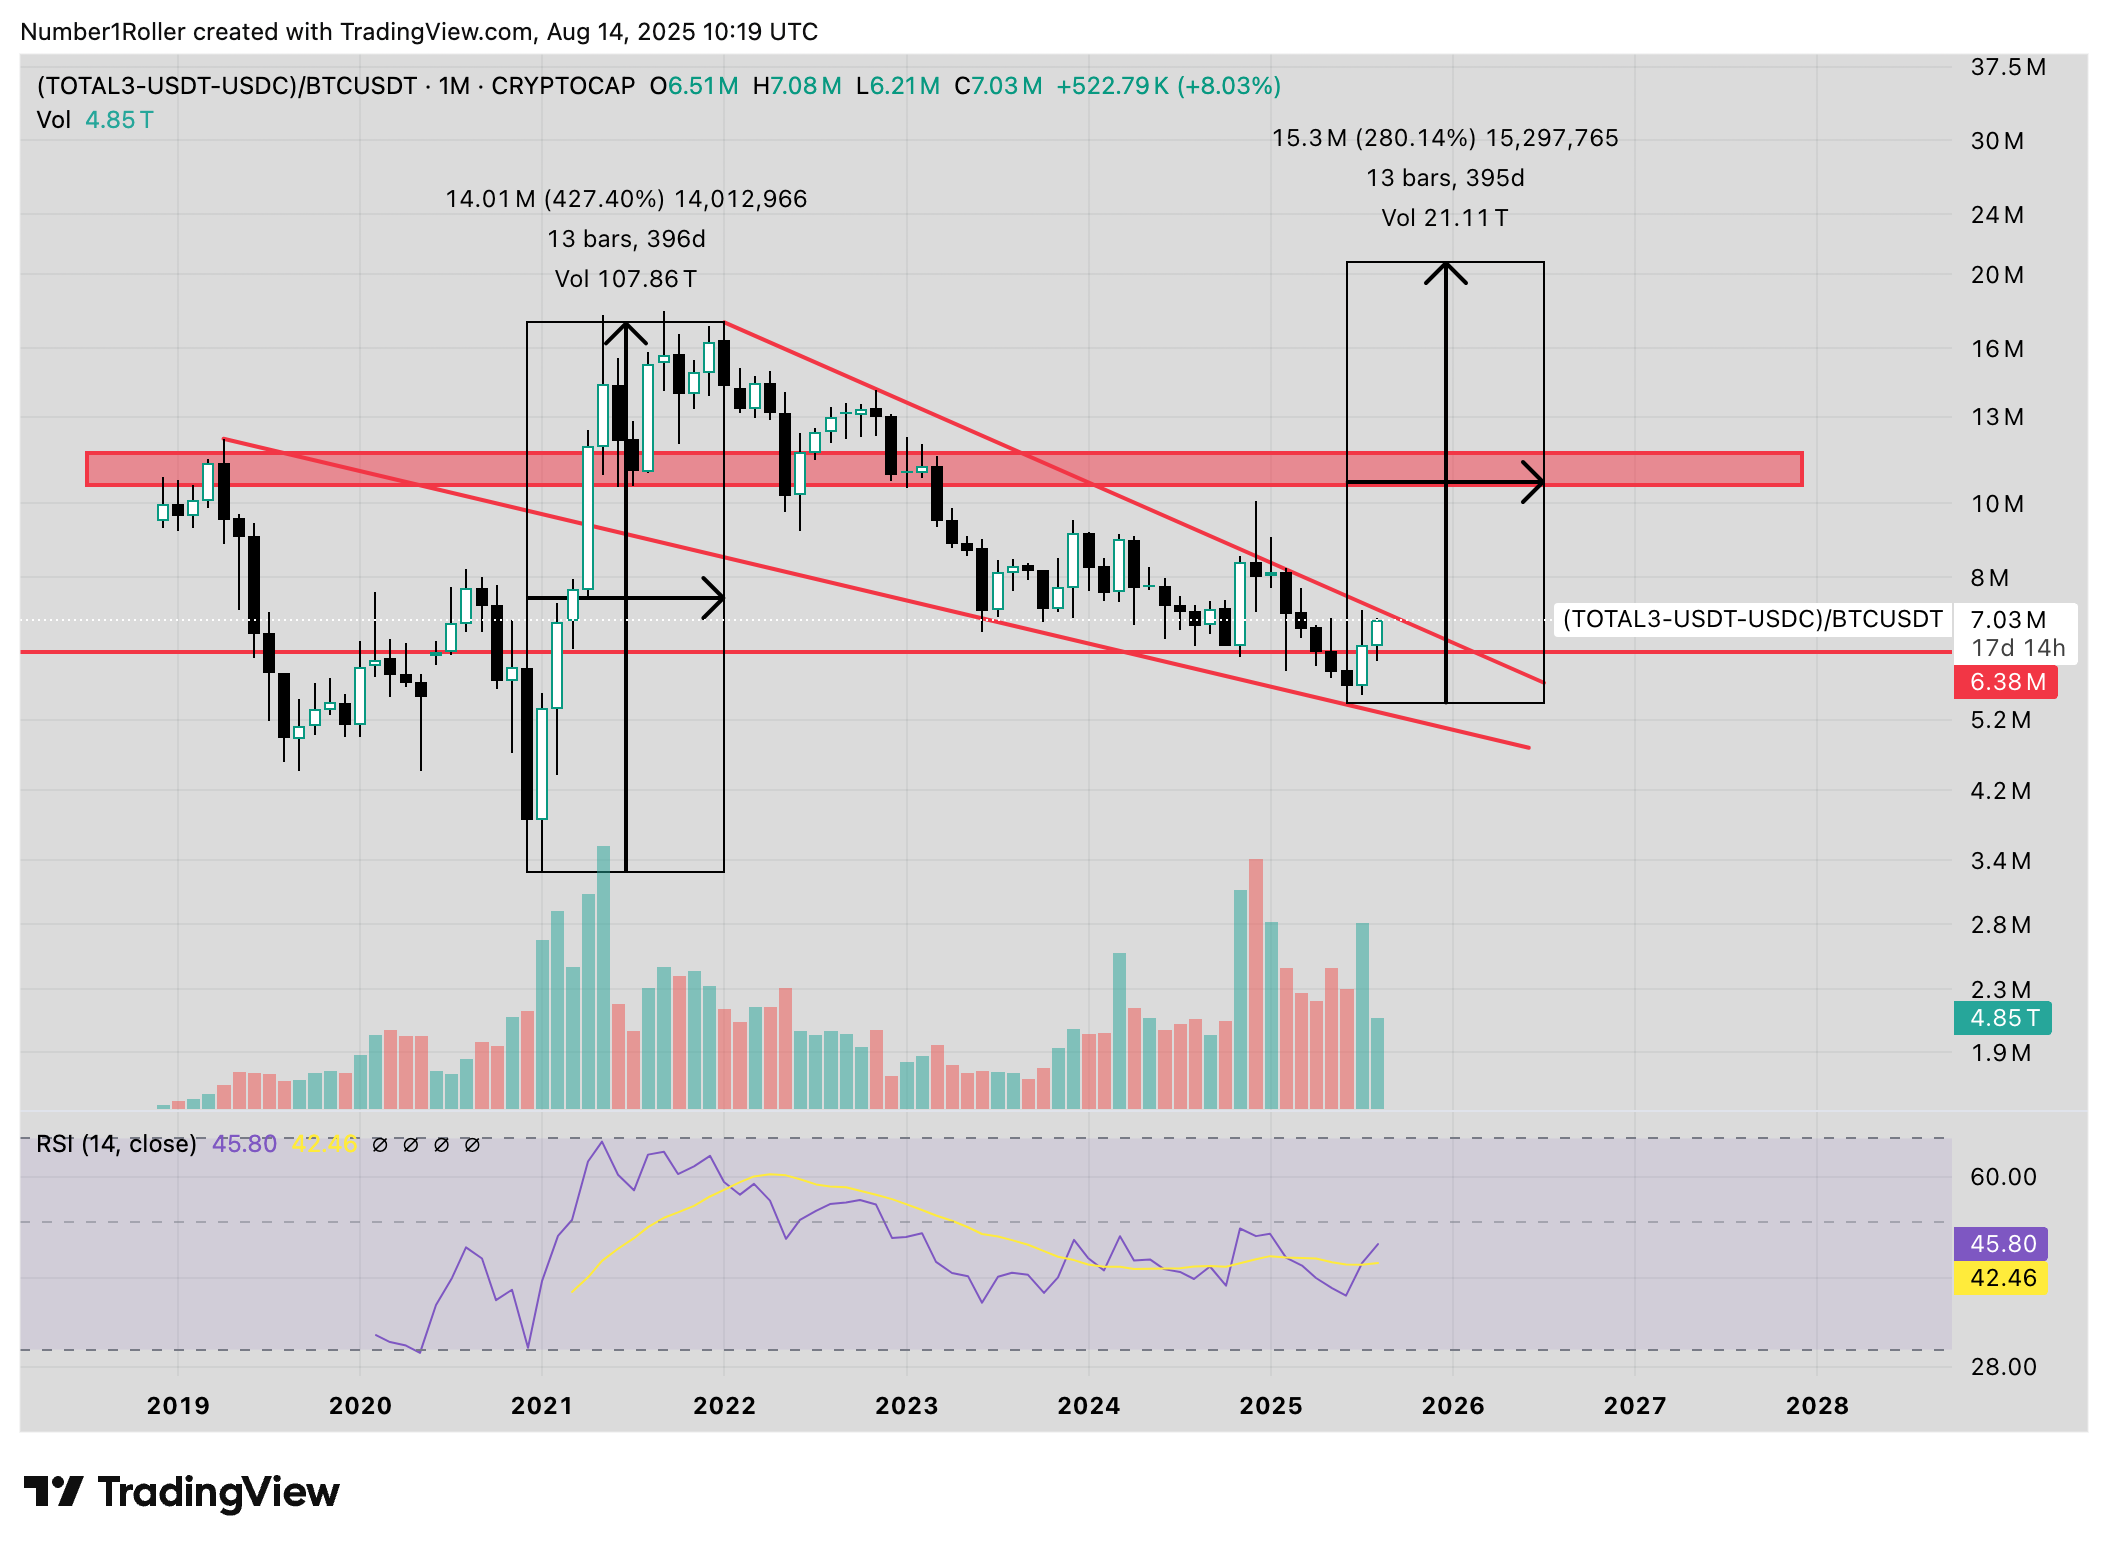
Looking below at TOTAL3 vs BTC we can get an idea of some of the time it will need. Not only is it barely scratching the surface and has yet to break out but typical runs last 12 to 13 months putting us deep into next year.
Then just quickly looking at the overall OTHERS chart we see the same thing but on an even longer time frame. The difference in the most recent bear market here is that it has been longer than ever. So when it does breakout we should expect a big run and more importantly a long run.
You cannot seriously analyze any of the above charts and conclude that a breakout would be over within eight weeks time. We are looking at 12-18 months of upside on these charts.
Halving Theory
Finally, we get to the halving theory which in my understanding is the whole reason for the four year cycle idea in the first place correct?
Well if the halving theory were correct then why did we make a new ATH before the halving in 2024? According to theory we should not make a new ATH until after the halving.
And then again, why did we crash in Q1 on the 4th year of the four year cycle? That has never happened before. Yet everything is still the same right?
Seems to me like lots of cracks have already opened yet like a bear in a bull market these people refuse to give up and accept the facts.
Here is a novel idea below by Adam Back who is a well know BTC OG and was even cited in the whitepaper.
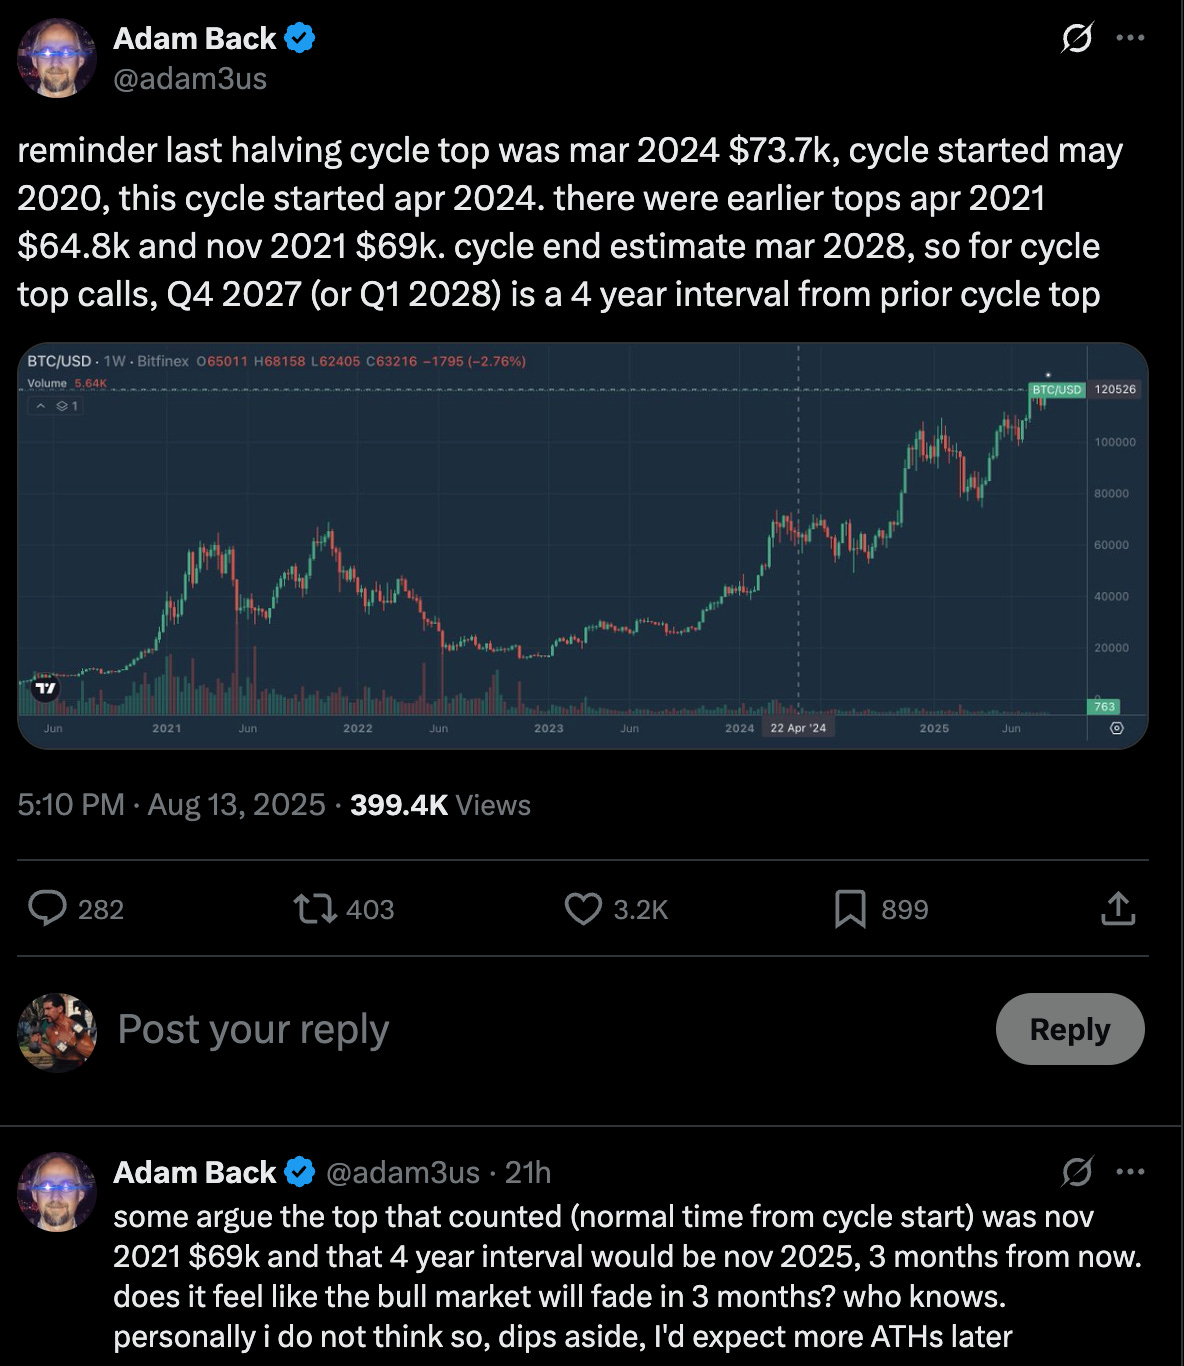
He points out that the cycle top was actually in April of 2024 because that technically was the top of that halving cycle and the next halving cycle end in mid 2028.
Interesting viewpoint and a valid one in my view. It doesn’t mean that BTC cant have correction along the way to 2028 or that 2028 is my cycle top target, it just goes to show that the halving really has no effect on BTC price.
Here is a view of BTC halving and cycle tops

Wrapping Up
That was quite a rant but clearly I feel very strongly that there is overwhelming data suggesting that the 4 yr crypto cycle will not conclude this time. It’s clear to me that the contrarian viewpoint right now is that we are going much higher for much longer whether that be in stocks or cryptos.
While everyone is worried about the four year cycle and overvaluations I suggest you take a good hard look at the actual data and facts to back that up.
Any market veteran can tell you the sentiment is simply not there for a major market top.
Far too many people are ready to sell at a moments notice when ETH hasn’t even made a fresh ATH yet, ALTs are about to break out of a four year consolidation, and between the DOW and the Copper/Gold Ratio we have the market telling us the runway is far longer than people think.
As I said on X the other day longer cycles are harder, not easier. And because people think that we are so early that it wont go long because that would mean they would get too rich. That’s simply not the case. The longer the cycle goes the more likely people are to lose.
Not enough people are accounting for the fact that we did indeed have a full bull market in ETH from June 22 low to April 24 high followed by a complete one year bear market. Everything suggest to me that this is the accurate view to have from a time price and sentiment standpoint but most are missing it.
The wall of worry, fear, and doubt is what will continue to fuel this bull market far longer than anyone thinks. The fact that most people are stuck in the four year cycle is just another log being added to the fire.
Remember, the market will do whatever it takes in order to fool the most amount of people.
Just because we are headed for a long bull market doesn’t mean it will be easy. There will be dips, pullbacks, and corrections along the way that will fake out even the most seasoned veterans. Having a framework to understand the territory will be critical in getting you to the spot on the map so many are trying to find.
Brilliant post thanks for sharing